

The speed of a website often determines how likely we are to stay on it. In fact, for some us, speed is even more important than the look of the site. It can be extremely annoying to have to wait for a page to load, and more often than not, we lost interest pretty quickly and move on.
This is bad for business. If you want customers to linger just a little bit longer on your products, if you want your SEO rankings to remain competitive and generally provide a better experience to the visitors of your site, then speed should be somewhere near the top of your priority list.
Fortunately, among the many bountiful gifts of the internet are free tools to do just that. These services measure the speed a website or application so as to better enable optimization. The programs go through an array of different measurements to accomplish this.
Among the things they look at are problems with plugins that can cause loading issues, analyzing your Content Delivery Network (network of proxies and data servers that hold the bulk of your site’s stuff), discovering large media files that are holding up information flow, assessing the JavaScript and a lot more.
While there are a plenty of such tools to choose from, below you will find 15 of the best ones available. Before we get to the list, however, we should go over some basic website speed terminology so you can get a better understanding of what the tools offer and how they differ.
Time to first byte. This is a basic concept in web speed analysis. It is a measure of a web server's responsiveness. When you enter an address in the URL bar at the top of your browser, you are sending a request to that page to load. How quickly it responds to your request is the time to first byte.
HTTP requests. When you send that request to the server, the website and your computer communicate through what his called hypertext transfer protocol. HTTP is basically a series of messages that pass between your terminal and the server hosting the site. The more HTTP requests a certain website makes, the slower it is. You can decrease the number of HTTP requests in many ways, including removing 3rd party plug-ins.
JavaScript and CSS. These two terms describe the language in which many websites and website components are written. In relation to website speed specifically, we are usually interested in a property called render-blocking, which is what some website components that run JavaScript and CSS use to make sure they are loaded before anything else. Understandably, this can slow down the whole site.
Minification. As the name implies, minification is the act of removing any extraneous elements from your website. The goal is to achieve a bare-minimum style of your site which has all the necessary information yet is easy to load. Minifying tools do things like remove white spaces and newline characters.

Website Speed Testing Tools
1. Uptrends

The great thing about Uptrends is that offers over 35 different places for you to choose from when doing your speed test. The final report gives you both an assessment by domain group and a waterfall breakdown (waterfall charts let you see visually the cumulative effect of sequentially introduced positive and negative values). The domain groups report then goes into further detail, putting the resources into different categories (e.g., social media, advertisements, third party, etc.).
The Waterfall Analysis lets you determine exactly what elements in your site are causing the greatest delays. It inspects HTTP headers per element, making it extremely simple to analyze root causes. The Domain Groups analysis is flexible enough to let you decide which configuration you want to check your website through.
Among other things, Uptrends offers real-time browser monitoring so you can experience what a typical user would experience visiting your site, with information on errors, uptimes, and total load time, presenting it all in an easy-to-access format. The Full Page Check allows you to see how each element of a website influences load time. Third party monitoring is included with the Full Page Check, so you can prevent third-party content from slowing your site down.
The Uptrends package comes with user analytics, social media scripts, Content Delivery Network performance check and analysis of video player embeds. When all the analysis is done, Uptrends provides customized reporting, available by schedule. You can determine where in the world the site is experiencing problems, to better tailor your responses.
Touting itself as the world’s most powerful website monitoring tool, Uptrends comes with a 30-day free trial. Besides website performance monitoring, they also offer monitoring for the website itself, for web applications, for websites on mobile devices and for internal/external servers. Overall, Uptrends is a robust tool, offering insights based on location, measuring performance in high detail and providing use across different internet protocols (including HTTP, DNS, and SQL).
2. PerfTool
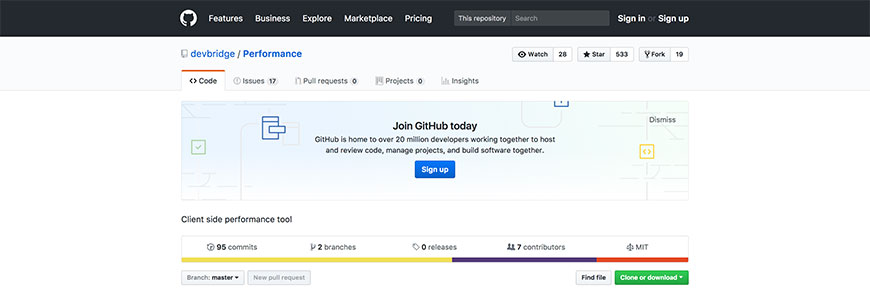
PerfTool is a completely open source tool originally conceived as a project on popular software repository and web hosting service Github. PerfTool is a client-side application that collects information about the website and then displays it. The reports it generates are very easy to read.
According to its Github page, perftool is ‘an npm package that is used to display information about web pages—Google PageSpeed Insights score, HTML errors, information on how to fix performance issues, CSS resources count, and more.’
The benefit of PerfTool is that it combines three data sources into one. There is Google PageSpeed Insights (discussed below) which tests the basic performance of the site, Devperf to give you statistics, and W3CJS to validate HTML (checks the code to make sure it is correct).
PerfTool offers over 200 different indicators of performance, including such things as statistics on the page, recommendations, resource counts, loading times and errors in code. You can test multiple pages simultaneously when you get the PageSpeed report. With this information, you can compare the current performance with past performances, or set a score benchmark.
PerfTool is particularly useful if you are testing the entire site at once, as you do not have to test it page by page. In addition to the Perftool, the developers at Devbridge also publish a style guide to help users create, share and automate visual library of their brand. Devbridge has previously worked with AON, Fitch Ratings, Mazak, the Art Institute of Chicago and kCura.
3. KeyCDN Speed Test
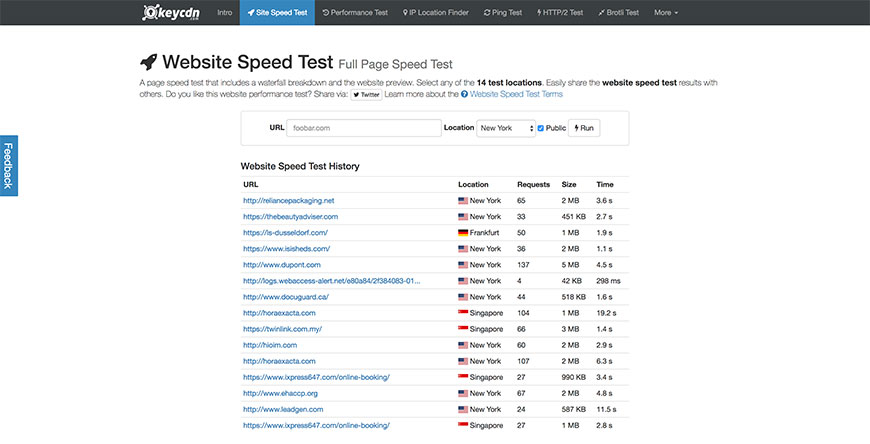
KeyCDN offers a remarkably quick and light performance test with rich details. There are about 14 different locations to choose from, and you have the choice of making your results private or public. The reports that KeyCDN’s Speed Test develops include a waterfall breakdown and a preview of the website.
From the reports, you can see the number of HTTP requests made, the size of the requested page and the loading time, among others. The tool is very responsive and also works on mobile phone. KeyCDN draws on its experience of being a real-time Content Delivery Network (CDN) in providing this website performance tool. A CDN is a network of proxy servers and data centers distributed worldwide that offers high availability and performance in delivering services to customers. They are used, for example, to ship software packages and games.
KeyCDN’s Speed Test is HTTP/2 ready, making it among the more advanced website performance tools. HTTP/2 is an advanced version of HTTP published in 2015. In addition, the Speed Test offers TCP optimization. TCP or Transmission Control Protocol is the set of protocols that govern how data packets are sent on the internet. KeyCDN’s Speed Test also has 100% coverage for SSD (solid state drives), meaning that the tool can test pretty much on anything.
On top of HTTP/2, the Speed Test features origin shield, RESTful, real-time state and instant purge. The global network that KeyCDN uses inbuilt on IP Anycast and routing is highly latency-based, meaning there are a good performance, scalability, and speed. The network, as mentioned earlier, is ideal for games and software delivery, but also for ads, different kinds of websites and content management systems (e.g., WordPress).
The network of servers in the CDN is positioned to not only provide speed, availability, and scalability but also to ensure that page requests always go to the nearest point of presence. The close the user is to the POP, the faster the page will load and the less data loss there will be. In this way, CDN helps to cut costs and promote scalability. With perks such as these in the overall network, it is no surprise that their website performance tool is so top-notch.
4. dotcom-monitor
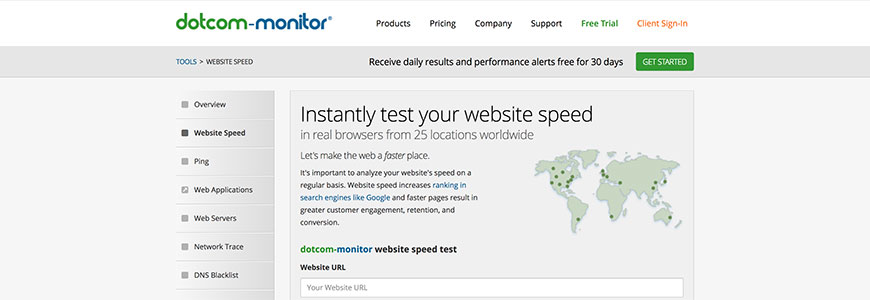
The beauty of dotcom-monitor is that it provides testing from 25 different locations and on seven different browsers. You can even run all global tests at the same time. With other tools, you can only run them individually from each location. Once the test has been done, you can choose individual reports for a waterfall breakdown analysis.
The reports come in five sections: a summary, the performance, the waterfall chart, host analysis, and errors. Due to the interface being so easy to use, all the information is in readily understood. Through its quality reports, dotcom-monitor allows you to see which elements of your website are slow or missing, and it presents you with the loading time by browser of all page elements.
The service is completely free and even allows testing through cloud services (e.g. you can test your site on Amazon-U.S.-east) and across national firewalls (e.g. the Great Firewall of China). The team at dotcom-monitor are constantly developing new tools so it seems like the tool will be able to do even more.
Right now, the reports allow you to monitor your site’s performance 24/7, with summaries by location. You can determine the fastest and slowest 10% of elements, with information provided on the easy-to-read waterfall chart. The reports also provide a breakdown by host, as mentioned earlier. This includes DNS, SSL, first packet, connection, download, etc.
The DNS or Domain Name System is essentially the internet’s phone book, allowing it to look up any device connected to it, while SSL or Secure Socket Layer is the main security technology of the internet, allowing encryption between data sending and receiving.
On top of all that, the tool lets you check for errors and diagnostics. You can test a network’s connectivity with a ping test, which measures availability and response time on the network. This lets you diagnose errors even faster. The Minneapolis, Minnesota-based dotcom-monitor is currently working on a new load testing platform to provide users with even more functionality.
5. Varvy Pagespeed Optimization
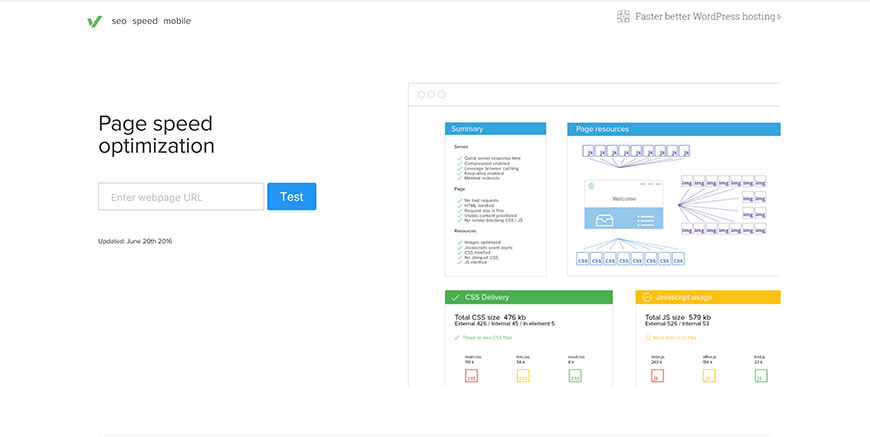
Developed by Patrick Sexton (the man behind local listing service Moz Local), Varvy Pagespeed Optimization is a tool that provides reports in five sections. These are CSS delivery, page speed issues, resource diagrams, services and JavaScript usage. Using all this information, the site provides a graphical representation of what can be optimized (e.g., render-blocking). One entire section of the Pagespeed site is dedicated to SEO, and there are countless useful tips on how to make your site more SEO friendly.
Mr. Sexton does a great job of offering documentation on how to optimize websites, and Varvy is more a set of tutorials than an outright service. The tutorials include lessons on critical rendering paths, using browser caching and deferring JavaScript loading.
There is also instruction on reducing server response times, enabling compression, enabling keep-alive, minimizing redirects, prioritizing visible content, optimizing CSS delivery, CDNs, avoiding bad requests, deferring JavaScript, minimizing DNS lookups, and much, much more. Each tutorial is explained in a simple, engaging style with Patrick’s own little diagrams to guide you along the way.
If you are new to the webperf (website performance) world, there are few better places to start than Varvy. One of the best aspects of the service is its mobile optimization guide. Ever since Google increased the strength of the mobile-friendly ranking signal in May 2016, there has been greater emphasis placed on mobile site accessibility. To ensure that your site stays competitive in the smartphone, you should definitely go through the Varvy tutorial on mobile optimization.
6. PageScoring
PageScoring is simple and easy-to-use tool with minimalistic design. With its reports, you can see the overall loading time and also domain lookups, page sizes, download times, redirection times and connection times. You can also see all your assets (i.e., page elements, including content, graphics, video, etc.) and how long it took to lead each.
If your goal is to check your website's performance in a quick and painless manner, then PageScoring is probably your best bet. Like websites themselves, these performance tools will be judged on how quickly they work. Studies show that 50% of all website visitors expect a site to load in 2 seconds or less, while 40% will abandon the site if it takes more than 3 seconds to load.
Similarly, testing a site’s performance is also something many people want to be done quickly. PageScoring allows you to just enter the domain name and then quickly provides a richly detailed display of how long the contents took to load, as well as a report on various transmission processes. It is a great tool for measuring performance in real-time and in such a manner that isolates pieces of data to improve analysis and improvement measures.
The Pagescoring interface is probably the most bare bones on this list. If you visit the link below, all you see is an address bar, literally three sentences, and a feedback button. But do not let appearances fool you. Pagescoring is still a robust tool to assess your website’s performance.
7. Sucuri Load Time Tester
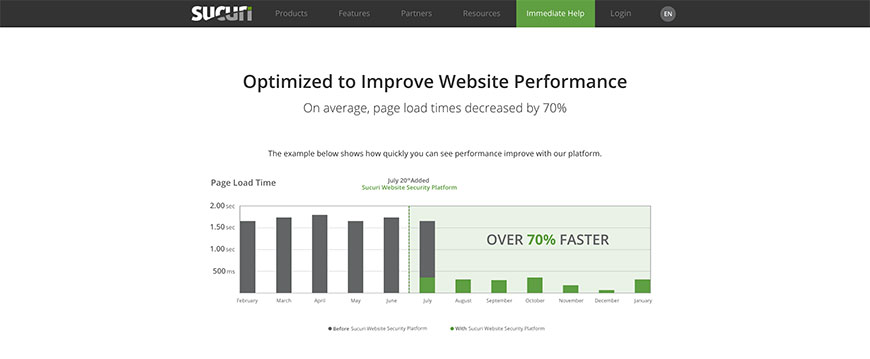
Another quick-and-easy tool is the Sucuri Load Time Tester. Based on worldwide network of hardware support and testing, Sucuri gives your site a global rating from A to F. It measures how long a user takes to connect to your site and how long it takes one page to load fully. (i.e., time to first byte or TTFB).
An important thing to remember is that the use of a CDN will likely affect the operation of the tool. With a CDN, the connection time is likely to be low. You will not get much use of this tool in terms of performance if your TTFB and total time are not already on the low side.
In addition to performance testing, Sucuri also provides web security and protection, back up tools, and firewalls with detection. Overall, the service claims to have increased page load times by 70%. Due to its existing CDN network, Sucuri can integrate with a user’s existing CDN, with a configuration team on standby to deal with any technical hurdles.
Sucuri’s own servers are pretty high-performance, built on a global Anycast network. (Anycast is an addressing and routing method for networks in which data is sent to a node in the network based on proximity, cost, health and other measures). Sucuri offers fast HTTP/2 support, GZIP compression, an optimized configuration and smart caching.
What this means is that there are high availability and redundancy built into the network, which helps in case there is network failure. Security on the Sucuri networks is also highly advanced, with a Security Operations Center operating 24/7 all year long that will respond to any attack.
Using Sucuri’s Load Time Tester will help improve speed with caching and CDN; using Sucuri’s network will defend against Distributed Denial-of-Service attacks, hacks, brute force attempts. As an added plus, you do not need to install anything to use Sucuri. All you need is a change in DNS, which their team will help you set up.
8. Google PageSpeed Insights
One of the best tools out there for testing website performance is Google’s PageSpeed Insights. The tool is so good, in fact, that many of the other tools on this list merely present information taken from PageSpeed. The service grades your site from 1 to 100, with anything above 85 considered to be good. There are desktop and mobile versions of the tool. With its report on your site’s performance, it also provides recommendations (e.g., to change images).
PageSpeed measures two things—the time to above-the-fold load (i.e., how long it takes for the upper half of the page to load) and time to full page load. On mobile reports, there is also a User Experience tool that you the score along with viewport configuration, appropriate font sizes, and sizes for tap targets (like buttons and links). A new speed test tool within the Think With Google service presents all this information in an attractive manner.
The PageSpeed works by getting the domain URL twice, once each from a desktop and mobile agent. The result is a site rank out of 100, on the basis of which sites get categorized into ‘good’, ‘needs work’ and ‘poor’. In addition to its desktop and mobile versions, PageSpeed has a Chrome Extension which allows you to test any page from the Developers Page Speed tab.
Overall, Google PageSpeed Insights gives you a wholesome picture of the site speed and what you need to do to improve it. Because the tool belongs to Google, you can be sure that it is constantly being improved upon.
One thing worth noting—the tool gives you a measure of your sites’ relative performance, based on network-independent aspects of page performance (HTML, internal and external resources, configuration). The absolute measure of your sites’ performance depends on your local network and hardware conditions.
9. YSlow

YSlow is an open source alternative to Google’s PageSpeed based on Yahoo!’s rules for high-performance websites. The tools analyze a web page and tell you it performed in relation to Yahoo!’s rules. The project is maintained by Marcel Duran, of the Web page Test Project.
There are three steps in the process with which YSlow tests a site. It first crawls the DOM (Document Object Model, an application interface that reads HTML and other web code to generate a page) to find all the elements. It then gets information about each element. Finally, it takes the information and generates grades for each of the rules, resulting in an overall grade.
Yahoo!’s rules for high performance websites are a collection of 34 rules affecting web page performance. They were designed by Yahoo!’s Exceptional Performance Team. YSlow uses 23 of these rules in its testing. Among these are minimize HTTP Requests, use a Content Delivery Network, make JavaScript and CSS external, reduce DNS Lookups, operate on multiple browsers.
10. Pingdom Speed Test
The Pingdom Speed Test is among the better known of the tools on this list. The report it provides is divided into four sections: a waterfall chart, a performance grade, page analysis and history. The page analysis is further divided into size analysis, size per domain, requests per domain and the type of content with the most requests.
Pingdom tests the site at four location (two in the U.S., one in Australia, one in Sweden) and its performance reports include suggestions on where the site can be improved. The results break down both page size and requests by content type and domain. The service is free of charge, offering attractive visual depictions of load time for each page element.
The Page Analysis function is highly detailed. It gets deep into server response code and tells you such things as site speed and health. Due to the existence of different locations, there are virtually no routing issues. By the same token, accessibility is not a problem either. Page analysis gets into HTTP server response codes (indicate site speed, overall health).
On top of the four locations used to test, there are 70 global locations for polling, available all year long. Even with advanced features, Pingdom is cost effective. It examines all parts of the web page (loading times, file sizes, etc.). You can sort and filter the information in whatever way you want. Not only are there performance measures and recommendations, but you can also see the trends in your performance history and share your results.
11. Pagelocity

Pagelocity offers a special approach to website performance testing. It scores sites out of 100, like other services, but includes as factors such things as social media, Search Engine Optimization, resources, and code. You can also track your competitors for comparison. This is all even without registration. When you sign up for a free account, you get more features.
The Pagelocity results come in code view and resource view. The code view shows if you are running over HTTPs, what the time to first byte is and also presents the DOM elements in a graphical method. The resources view shows which web elements are taking up the total page weight (images tend to be the biggest).
According to their homepage, Pagelocity has analyzed nearly 15,000 pages so far, which is on the low end among the tools in this list. But again, the competitive advantage you can get by seeing your competitors’ performance is unique to this service. You can do side-by-side metric comparison to identify your comparative strengths and weaknesses.
The assessment of the website’s content goes through keywords, headings and alternative image text to make the site more attractive. The reports include a breakdown of resources and coding advice on HTML and CSS. This includes help with classes/Ids, tags, time to first byte and PageSpeed analysis. The reports are presented with a lot of glitzy data visuals and there is plenty of feedback on performance.
The app is very easy to use and responsive. It works on a number of devices and platforms. App is responsive and available on a host of devices. The online website analyzer Pagelocity is the work of Romanian Andy Gongea.
12. WebPageTest
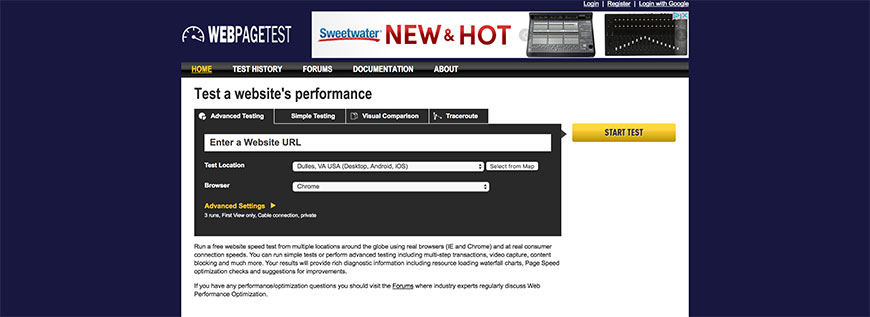
The WebPageTest does a performance test on a given website in over 40 different locations, in 25 browsers, including mobile. These numbers alone tell you how exhaustively useful this service can be. Websites are given a grade from A to F based on time to first byte, compression, effective CDN use and caching, among other metrics.
The reports generated are divided into six sections: a summary, details, content analysis and breakdown, screenshots, and performance assessment. WebPageTest takes a unique approach to website performance testing. It includes a first view and repeat view which help to diagnose the 1st time DNS lookup delay mentioned earlier.
Additional features of the service include video capture, multi-step transactions, content blocking, disabling JavaScript, capturing video, ignoring SSL certificates, and others. The service is particularly useful for global websites because it targets different areas and also people using different browsers.
The reports are rich and detailed, with waterfall charts, PageSpeed checks and many useful suggestions.
13. Google Chrome Dev Tools´
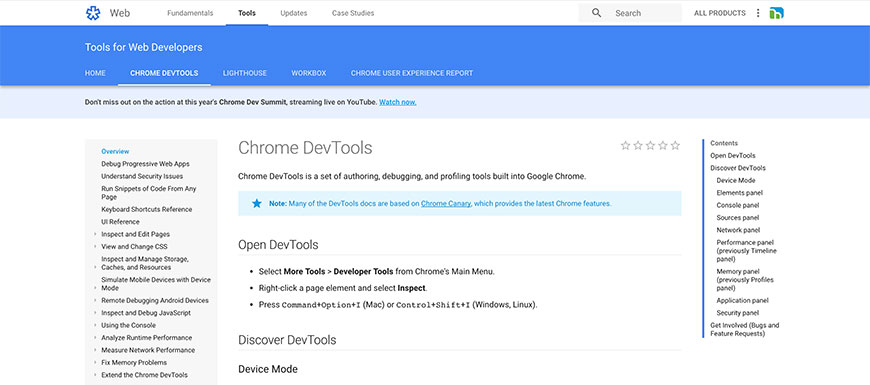
Google makes it to this list twice simply because it is Google. The built-in website performance analyzer in Chrome’s DevTools tab is very easy to use, but also comes with many advanced features. You can launch DevTools anytime you want (F12 or Ctrl+Shift+I on Windows, Cmd+Opt+I) on Chrome. Developer Tools is a set of web authoring and debugging tools built into Chrome.
The latest DevTools updates take the old waterfall timeline and adds a panel on aggregated details. You can see what each element costs you in terms of time and find out which is the most costly. Moreover, you can break down the analysis by domain, subdomain and other categories. The service lets you see the loading time for DOM content and the total loading time.
The network panel is where you go to measure performance. You can use it to record and analyze network activity, to view loading information (for individual elements of the site as a whole). You can filter and sort how and which information is presented, and customize the panel in any way you want. There is also an option to see render-blocking resources (which we discussed above).
14. Yellow Lab Tools

One of the latest website performance tools is offered by Yellow Lab, brought to you by French webperf expert Gael Metais. The Yellow Labs tool has a lot of information for users and also presents a host of unique features. These include views of JavaScript interactions with the Document Object Model and various code validation issues.
The final global score that Yellow Labs gives you is based on several factors: page weight, DOM, CSS, requests, JavaScript and server configuration. Using the Yellow Labs tool, you can simulate different devices (desktop, tablet, phone) to see how your site performs on each. There are various kinds of tests you can do as well, including front-end (HTML, CS, JS), JS profiling (to clean up the JavaScript code) and web performance (which checks against industry best practices).
The tools are open sources and work by sending your site through a PhantomJS. This allows it to collect metrics and stats, which then give you your score. The details that the tool offers developers allow them to correct errors and optimize the site. The Yellow Labs tool is completely free.
15. GTmetrix
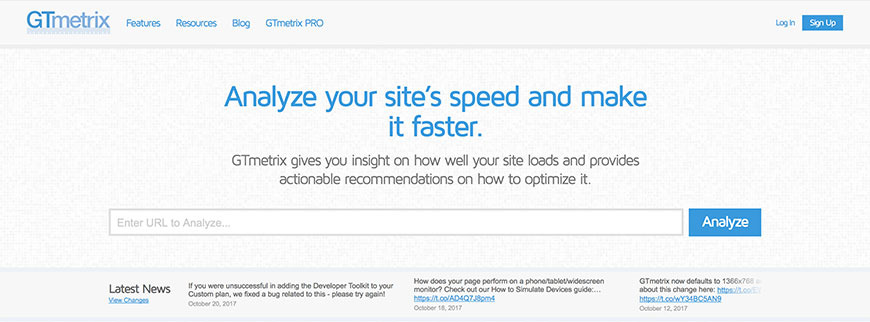
GTmetrix is one of the best web performance tools in the market. It presents a highly detailed assessment, based on both PageSpeed and YSlow metrics. The final grade it gives ranges from F to A. The GTmetrix performance report is divided into five sections: PageSpeed, YSlow, waterfall chart, video, and history. You can test your site from seven different locations with just a free registration, and choose between Chrome and Firefox.
The GTmetrix tools also let you test across different kinds of connections (cable, dial-up, etc.) and offers advanced features like video playback and Adblock support. The video playback lets you see exactly where bottlenecks to your site’s loading take place and the Adblock function lets you see how your site behaves when there are no ads running on it.
With a free account, you get even more options. Cross-checking PageSpeed and YSlow, you can see a complete history of your site’s load times. There are a variety of reporting options on top of that. You can opt to transfer your whole test history to a CSV file.
GTmetrix is one of the most commonly used website performance tools, with by now more than 222,000,000 pages analyzed. The number grows every second. The companies that have been involved with GTmetrix include PayPal, Spotify, GoDaddy, Nike, HP, NBC, and Nordstrom, among others.
With GTmetrix you have the option to monitor your site daily, weekly, monthly or even (with GTmetrix Pro) hourly! You can set up email alerts based on certain conditions being met (for example, the PageSpeed score dipping below a certain threshold or page load times reaching a certain value, etc.).
With 12 servers in 7 locations (Asia, South America, North America, Australia, UK), GTmetrix is one of the most robust tools on the list. It even lets you check your performance on an Android phone, where you can see a visual record of how your site loads. This helps you identify where the lag is occurring. The video allows you to slow down the process to a fourth of its original speed, as well as let you move to major page load milestones, with a filmstrip-like view that lets you see page loading in a new, dynamic way.
The developer toolkit that GTmetrix provides gives you the option to simulate pages on different kinds of devices, with different screen resolutions. You can create a set of presets for a frequently used option. Overall, GTmetrix provides monitoring, visualizing, zoom and pan, annotation, alerts. The Pro version comes in bronze, silver, and gold (at 15, 50 and 150 USD per month respectively).
Making Improvements
Once you’ve chosen which tool to use, there are some things to keep in mind. For one, running any of them will result in a slower first-time DNS lookup. The Domain Name System is basically a list of the names of all computers and devices on a network (such as the Internet). The DNS is referenced when a certain computer is on the internet, and looking up the device takes time.
How much time may depend on the tool you are using. This is why it is generally advised that your run multiple tests and take an average to get a better idea of your website or applications’ speed. It is also advised that you test your site regularly and set up some kind of target over time. You can see your site’s trend over time and adjust things accordingly.
Virtually all of the tools listed will tell you what you should do to improve your speed. Once you know why your website is not performing at its optimal speed, it is simply a matter of following some of these (often straightforward) suggestions. This can include compressing large images, decreasing HTTP requests, getting a faster web host, storing data in a cache and using more efficient code.
For added convenience, you may also want to test your website speed with a number of possible Chrome extensions. They are almost always free and can be run right from the browser. It is also a good idea to use website speed tests for mobile devices (after all, a large chunk of all page requests are sent from smartphones). Chrome Developer Tools even lets you emulate potential speeds on a range of mobile devices and at different connection speeds (e.g., 2G, 4G). Fun fact—70% of all connections worldwide occur at the 3G speed, and this will continue to 2020.
Whichever tool you use, the most important thing is to stay abreast of all the latest developments. If you want your site to be competitive, the first thing you should think about is how fast it loads. The slightest lag may result in innumerable lost views and visits.


Related Articles
- 4 Easy Ways to Search a Website for a Specific Word
- Should You Use Nofollow Links For SEO
- White Hat SEO vs. Black Hat SEO
- Redirection and the Impact on SEO Rankings
- 12 Page Speed Best Practices to Follow for SEO
- All About the Robots.txt File
- Web Accessibility and Search Engine Optimization (SEO)
- What is Speakable and How Can it Help Voice Search SEO?
- How to Prevent Blacklisting When Scraping
- JavaScript (JS) and Search Engine Optimization (SEO)
- What is Negative SEO, and How to Defend Yourself
- The History of SEO and Search Engines
- How to Build a Website for Search Engine Optimization
- Duplicate Content Issues Hurting Your SEO
- Top 10 Backlink Checker Tools for SEO
- Why Does SEO Take So Long for Search Engine Success?
- Top 10 Content Planning Tools for Content Marketing
- Seo Copywriting: How to Write for Search Engine Optimization
- Top 25 SEO Tips for eCommerce Websites
- Top 15 Plagiarism Tools for Finding Duplicate Content
- Top 25 SEO Blogs to Stay Up-to-date with Search
- The Best Content Management System (CMS) for SEO
- Social Media & SEO: Why Your SEO Strategy Needs To Include Social
- HTTP or HTTPS? The SEO Impact of Using SSL Certificates
- 35 Amazing Web Analytics Tools that Rival Google Analytics
- 25 Ways to Build Backlinks to Your Website for Free
- What Is Structured Data and Why You Need It for SEO
- 60 Innovative Website Crawlers for Content Monitoring
- Voice Search: How Our Voices Mold the Future of SEO
- Crawl Budgets. How to Stay in Google's Good Graces
- 30 Awesome Keyword Ranking Tools for SEO
- 43 Amazing Websites to Learn SEO Online
- Pagination or Infinite Scroll for SEO?
- How to Get Started Using Google Search Console for SEO
- CMS Plugins for Google AMP (Accelerated Mobile Pages)
- Are Keywords Still Important for SEO?
- Do Sitemaps Help SEO? The Importance of Sitemaps for SEO
- Getting Started with Search Engine Optimization
- SEO vs. PPC: Which One Should You Choose?
- How to Make Your Content Search-Friendly
Create Visual Sitemaps
Create, edit, customize, and share visual sitemaps integrated with Google Analytics for easy discovery, planning, and collaboration.
Popular Tags
Search Engine Optimization SEO Accessibility Testing Create Sitemaps Sitemaps UX User Experience Sitemap Generator Content Audit Visual Sitemap Generator
Get Started with DYNO Mapper
Join thousands of professionals using the most advanced visual sitemap tool to simplify discovery, IA, and content planning.
👉 Start Your Free Trial — No credit card required.