Search engine optimization (SEO) is a multifaceted industry with dozens of techniques designed and developed to push your blog or website to the fore—or at least toward it. But how do you know whether your efforts are paying off? Sure, you’ll probably find that you get more subscribers to your blog, or be getting more purchases from new clients on your ecommerce site, but that’s not a very accurate means of measuring your SEO success. So how do you know just how visible your site is? Well, that’s where web analytics tools come in.
What is Web Analytics?
Web analytics is a process of analyzing how visitors on your site behave. There are many ways in which this is done and the type of data you’ll receive through web analysis (as well as what you can do with this information), which we’ll get into in the next section. Ultimately, “web analytics” is the term used to describe the gathering of data relating to your website’s performance. Web analytics is designed to give website owners information on how visible their site is and what type of interaction is happening between the site and its visitors.
Why Use Web Analytics Tools?
Web analytics tools are designed to make website analysis easy. The idea is to gather, organize accurately, and present data on your site’s performance for you—essentially performing the technical side of web analytics.
This data is most often used for customer relationship management (CRM), in several significant ways. Web analytics tools will help you quickly discover how successful your SEO efforts have been. For example, a good web analytics tool will tell you how many visitors your site has had over a specified period, whether all of these visitors have viewed your site before or if there are any new visitors. You’ll be able to see where your site is generating the most views from, as well as which pages and products are the most popular.
The goal of a web analytics tool is to make accessing this data without having to read through your online sales records, track down how many times a page has been shared, or count the number of comments on each post. More importantly, the web analytics tool will present you with this data in a far more accurate format than trying to go about it the manual way.
Think about it for a moment: how likely is it that you’ve shared every website page you’ve ever read? Chances are, you’ve only shared the smallest percentage. You’ve probably commented on even fewer pages than what you’ve shared (although the same can be said the other way around). And when it comes to online stores, it’s highly unlikely that you’ve bought every single item you looked up.
This is why web analytics tools don’t only take the shares, comments, and purchases into account, but take pageviews, locations, and sources into consideration as well. By sources, we mean the way your visitors found a certain page. Was it one of your backlinks that led them to your site? Did the visitor punch in a query on Google and find your page that way? This is important information to have because they can help you discover which SEO tools and methods are working best, and why.
Concerning backlinks (in this case, specifically the incoming links from other sites), it can even help you accurately determine which affiliates are generating the most views and sales for your business. This sentiment is especially important if you have an affiliate program whereby sites that refer clients to you are given compensation.
The way you use this data is entirely up to you, but there are many practical ways in which it ought to be used. As mentioned, you can see which SEO methods are the most effective (as well as where and why, to a degree), which can help you improve pages that aren’t ranking as well and plan new pages better. You can also see what type of content—and this is particularly the case of products sold online—is the most popular. The intent is, therefore, to be able to market your site and services and (or) products better, focusing your advertising and promotional activity on specific products toward specific customers (based, in part, on geographical location).
Web analytics tools are designed to make this decision-making process easier for you, so you can focus on applying your improved approach rather than trying to figure out which strategy will (and does) work best for you.
Why Use Anything Other than Google Analytics?
There are many reasons to use a web analytics tool as an alternative to Google Analytics, but there are three that are the most cited.
-
You may want to make use of two website analytics programs so that you can check one against the other for accuracy and (or) redundancy.
-
You simply don’t trust Google as a company (for any number of reasons), and you’re not comfortable with them having access to all that data.
-
Google Analytics isn’t giving you all the data you want or need.
The third reason is possibly the most common one, but it’s not quite as simple as all that, so we feel it’s worth explaining in more detail.
Google Analytics is an incredibly advanced web analytics tool, and while that’s usually a good thing, it’s caused a lot of issues for a lot of users. Many have stated that Google Analytics is too complicated for every-day users who aren’t web analysts by profession.
The tool is notoriously difficult to set up correctly, and most users have to sit with tutorials to do what should be the simplest of tasks, such as creating a conversion goal and tracking it. Setting up in-depth analysis for user interaction and retention, let alone e-commerce, is even more challenging.
Website analytics tools are meant to be used for more than just the data you can easily view by default. In fact, if that’s the only data you’re accessing then you’re not getting any real value out of your tool at all. Unless you set up a customized dashboard (which is frustratingly complicated to do), the default data is all you’ll get from Google Analytics.
Furthermore, Google Analytics has been found to have several errors. While no tool can be reasonably expected to be completely flawless, the list here is rather long—and there are several that you have no control over.
Google Analytics Flaws You Can Fix
Some of the errors you’ll certainly run into with Google Analytics can be resolved. We won’t go into detail on how to do so here, but we’ve listed these flaws so that you’re aware of them.
-
No page tags: to analyze your site, Google Analytics uses a JavaScript tag on each page. But often, the tag isn’t added—and while it’s easy to manually check every page of a small site to make sure it’s there, it’s next to impossible to do so for larger sites (especially those with hundreds or thousands of pages). No tag means no data, so this is a major issue.
-
Poorly placed page tags: this has a lot to do with the site owner or developer, truth be told, but it’s still worth mentioning. Many people think that the analytics code will slow down their page speed, so the script is placed at the bottom, after the body. This analysis means that Google Analytics won’t pick up on viewers who are clicking through pages very quickly.
-
Multiple tracking codes on one page: again, this has more to do with how the user sets the site up than anything inherently wrong with Google Analytics itself. If you’re getting an improbably bounce rate on your site, you likely have more than one tracking code present on your page.
-
JavaScript errors: while it’s obvious that if there’s a fault with the tracking code, it won’t work, a less known fact is that if any other instance of JavaScript on your page causes any error, then Google Analytics can no longer analyze the page at all.
-
In-page analytics are inaccurate: there are three main reasons for the in-page analytics to be completely wrong, and unfortunately, not all of them have practical solutions. If your page contains content that doesn’t have an HREF element, or the page does include Flash, then Google Analytics won’t track the page at all. And the tool won’t differentiate between different links leading to the same page—so you have no way of discovering which backlinks are more successful than others.
Google Analytics: Flaws You Can’t Fix
There are errors you have no control over and can’t resolve on your own. As mentioned, Google Analytics works on a JavaScript code. Some browsers have disabled JavaScript entirely, meaning you won’t get any data from those viewers.
-
Google Analytics doesn’t work if cookies aren’t accepted. If a visitor chooses not to accept cookies on your site, their firewall blocks cookies, or they manually delete their cookies (among about a dozen other reasons for there being no cookies), then you won’t get any data.
-
If, for example, a user opens a web page then goes out to dinner before coming back a few hours to continue browsing, the session cookie has timed out, and a new one is created. What does this mean for Google Analytics? Well, if a user is inactive for as little as half an hour before continuing, Google Analytics registers it as two separate visits—meaning your data is going to be way off.
-
The opposite can also occur, where two users visit the site on the same device. You now have two unique visitors, but Google Analytics picks them up as one—because the persistent cookie (which lasts two years unless deleted) is tied to the device, not the user. Conversely, if you visit the same site on two different devices—say, you’re browsing a site on your phone in the train, then get home and load it on your laptop to continue—then Google Analytics records it as two unique visitors.
-
If you’ve been using Google Analytics for a while, and decide along the line to set up a Goal Funnel, that funnel will only be applied to new data. This means you’ll get inaccurate data because the current analysis won’t be updated before comparisons are made.
-
Not all your data is going to be taken into consideration if you have a large or rather active site. Instead, Google Analytics will sample the available data—again making for inaccurate results.
So, what to do?
Well, take a look at these 35 amazing web analytics tools that rival Google Analytics.
Web Analytics Tools
1. Adobe Analytics

Adobe is a leading name when it comes to software: Photoshop, Illustrator, the most popular PDF reader, and many other programs bear the company name. Adobe Analytics lives up to the stellar reputation held by Adobe. One of the many difficulties encountered with other web analytics tools is managing your custom tags. This process often requires altering the existing analytics code to allow registered users to be tagged as well. But with Adobe Analytics, you won’t need to involve an IT team (or hire an expert) to set up a dynamic tag management system.
Adobe Analytics also offers real-time analytics, which is incredibly important if you need to make a pitch to potential investors and advertisers “on the spot.” You’ll also be able to track user activity on social media, third-party data integration, for your videos, and for mobile users. These are often not covered sufficiently by Google Analytics (mobile user analytics in particular, as mentioned in the previous section). The use of mobile browsers is at an unprecedented high, and optimizing your site (and your SEO strategy) for these users has never been more important than now.
Adobe Analytics’ advanced segmentation makes understanding your aggregated data much easier. This feature allows you to spend more time on implementing new and improved strategies rather than trying to figure out what those strategies should be. While it’s a tool everyone will want to use, Adobe Analytics is certainly an enterprise solution. You’ll need to contact their support team for a quote, but you can expect it to be in the $5,000 per month range.
2. Angelfish Actual Metrics

Angelfish Actual Metrics is designed to make viewing and understanding statistics on how your visitors interact with your site (or sites) easily. Angelfish also keeps your aggregated data within your network’s confines, proving full data security and making it a valid alternative to Google Analytics. If your business also uses internal and (or) external web-based applications, Angelfish will help you track user activity on these platforms as well. This is one of the glaring exclusions in Google Analytics and will give you a truer understanding of how your online platform is performing.
Sometimes, sites (or particular posts) experience a spike in traffic—especially when the content is new or being shared on social media a lot. Web analytics tools can get confused by this spike at times; Google Analytics is particularly notorious for showing the spike and then absolutely no traffic for a day or two after. But Angelfish handles traffic spike analysis very well, going so far as to incorporate a feature focused on these occurrences.
You’ll also receive data on hidden visitors—those that block analytics codes for any number of reasons—something that Google Analytics doesn’t even attempt to address. Furthermore, you’ll also be able to track the click path of your visitors, allowing you to see exactly which backlinks and ads are generating the most views.
And if there any broken links or bandwidth errors, Angelfish will pick them up and give you a full analysis. This tool is a cheaper premium alternative to Adobe Analytics, with a $1,295 per year Standard Package and $6,000 per year Grand Deal package.
3. AT Internet: Web Analytics

If you’re looking for an advanced web analytics tool that makes it easy for you to view, analyze, and act on your website’s data, then AT Internet: Web Analytics may be the solution for you. Analytics features offered include data on site navigation, traffic reports, an indication of the sources visitors use to reach your site (as well as how they interact with it), the type of device they’re using to browse, and what their geolocation is. You’ll also be able to measure the way your site visitors use rich media content.
Your site’s performance and uptime are monitored too, and you can get a complete breakdown of how individual online marketing campaigns are performing. AT Internet’s focus on behavioral analysis is particularly suited to helping you define your target audience and plan your marketing and content accordingly.
While we’re talking about online marketing, email campaigns are quite popular as well. Google Analytics doesn’t track and analyze site traffic initiated through these campaigns, but AT Internet’s Web Analytics most certainly does. ClickZone is a proprietary technology used by AT Internet to help improve your user experience through a combination of heat maps and overlay.
Despite being rather advanced, AT Internet’s analytical features are presented intuitively to make for easy navigation. You’ll also be able to set up customized metrics. Contact AT Internet to request a demo and discuss pricing.
4. AWStats

Considered one of the best web analytics tools available online, AWStats defines visitors according to their user agent (browser type, for example, Google Chrome) and IP address. This means that only real visitors are logged, and robots like GoogleBot are not counted as visitors. This is incredibly important if you want accurate results, as website crawlers and other bots will give a false boost to your site’s statistics.
AWStats analyzes a surprising amount of information, including log files from HTTP, FTP servers, and streaming media. The output is incredibly user-friendly, with the primary interface comprised of a single page separated into sections. This categorization allows users to differentiate between daily visits, search terms, a list of referrers (whether the visitor found your page via a search engine results page—SERP—or through a backlink on another site), and so much more. The statistics page is automatically updated daily, but you also have the option of viewing your traffic reports in a monthly or annual format.
Of course, no web analytics tool is completely perfect—especially not those that are available from open sources, like AWStats. The tool doesn’t provide sufficiently in-depth analysis of your data, unfortunately, nor does it track exactly how users are interacting with your site. Still, considering that the software is available free of charge, AWStats remains a worthy alternative to Google Analytics. In fact, AWStats is so viable that many hosting providers offer it as a pre-installed tool in cPanel packages. While you may not want to use it alone, it makes for a charming addition to run alongside another web analytics tool.
5. BBClone

Described by the developers as a “web counter on steroids,” BBClone is indeed an attractive solution for anyone looking for a free alternative to Google Analytics. The web analytics tool well-suited to gathering some in-depth data on the visitors to your site, providing an output that includes their operating system (OS), IP Address, and which browser they’re using. Furthermore, BBClone will also tell you exactly which page—or pages—they’ve viewed, at what time, and for how long they’ve been active on your site. You’ll also get information on how many times that visitor has been to your site, and BBClone will even number your visitors for you too.
If the visitor found your site in a SERP, the tool will tell you exactly what search query they used. When you consolidate this information, you’ll have an excellent understanding of who your users are and how they behave online—and especially how they interact with your site. You’ll have a better understanding of which backlinks to push, the type of backlinks to be pitching for, and what keywords you should be focusing on the most.
Another attractive feature is that unlike many other web analytics tools, BBClone doesn’t rely on MySQL databases either. BBClone is incredibly easy to set up as well. All you need to do is download the script, and start customizing so that you’re happy with the layout. The customization potential is massive, and you can easily integrate BBClone with any number of installations and programs.
6. Chartbeat
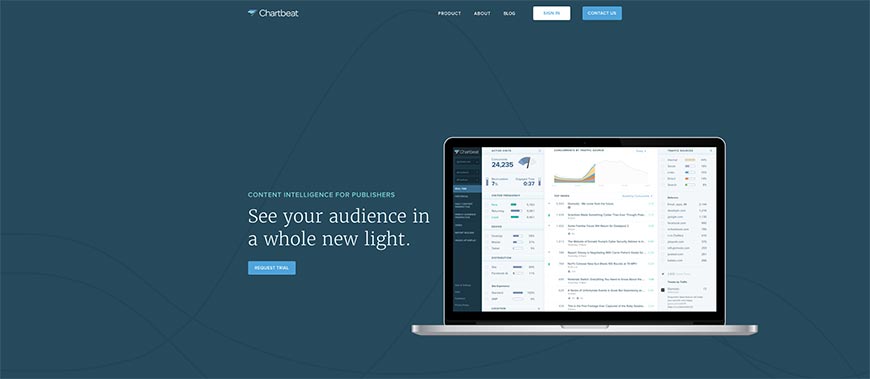
“Analytics for Editors” reads the tagline on Chartbeat’s website, and considering its focus on real-time data output we have to agree. Chartbeat is a web analytics tool that exists in the present, not eight to twenty-four hours in the past like Google Analytics. If your traffic spikes and your bandwidth allocation is being used up at a faster rate than usual, Chartbeat will send you a notification via email immediately. Hosting providers typically give a set limit to how much bandwidth your site is allowed to use, and you most definitely don’t want to get caught halfway through the month with no bandwidth left. If your traffic spikes, it’s great being able to make arrangements with your hosting company before you run out of bandwidth.
While the best hosting providers also monitor your site’s servers around the clock, they often won’t tell you when the server goes down for a very short period. Chartbeat will instantly alert you to any server downtime so that you can follow up immediately.
The web analytics tool has a very robust dashboard that displays a lot of relevant information. While most options only tell you what page a visitor is on, and maybe how long they’ve been there, Chartbeat goes the extra mile by showing you how far down the page they are too. You’ll receive data on exactly how your users are interacting with your content, as well as how they’re sharing your pages. Starting at just $9.95 a month, Chartbeat truly is an affordable (and fantastic) rival for Google Analytics.
7. Clicky

Clicky is easily one of the most popular web analytics tools available. If you search for alternatives to Google Analytics, chances are, every single page you open will include it on their list. There’s a very good reason for this: Clicky is one of the strongest tools on the market for web analytics, and unlike many of its competitors it offers real-time updates. The main dashboard might be a little overwhelming for beginners, but you’ll soon learn to love the variety of available statistics. This includes a link report, which tells you exactly which external sites and pages are actively directing users to your own. We’ve mentioned the importance of backlinks many times, and this tool helps you see exactly why.
Just like BBClone, Clicky also provides search data comprising of all the incoming search query keywords being used to direct users to your site from the SERP. Where Clicky overtakes BBClone in a big way is that the tool also comes with the Sheer SEO tool. Sheer SEO helps you to see how well your keywords are ranking, which is valuable information to have and understand.
Another interesting feature is Twitter Search Tracking, which lets you monitor Twitter tags, keywords, and retweets on the social media platform. ClickyTouch, the iPhone app, also allows you to stay up to date with all your analytics while on the go. Clicky is inherently free of charge and is available as a WordPress plugin too. If you need to use it on multiple sites, or your site generates more than 3000 views a day, you’ll start having to pay a minor fee though.
8. CoreMetrics
Often used by ecommerce websites, in particular, CoreMetrics was acquired by IBM in June 2010. It now also goes by the name of IBM Digital Analytics but is not to be confused with IBM Unica NetInsight—which we’ll get into later on as well.
This tool boasts an easy-to-use interface and offers detailed data statistics that are also highly customizable. No matter what your business type and model, IBM have taken the original CoreMetrics module and ensured that there’s a little something for everyone. With the increased personalization, users can better convert the analytics reports into actionable marketing plans. In this way, the company promises to extend your customer lifecycle by helping you find ways to retain existing users as well as attract new ones. Furthermore, they boast that this also gives you a higher return for the money you spend on marketing.
It’s for this very reason that the web analytics tool is so popular with online sites. You can see this more clearly when you realize that, unlike most of its peers, CoreMetrics also gives you a comprehensive report on the abandoned cart value—how much a client was going to spend, but didn’t. If nothing else, its popularity also proves just how invaluable CoreMetrics can be to an e-commerce business. With a price range starting at around $5,000, it’s not a viable option for small start-up companies. If you plan to use a premium web analytics tool alongside a free one, this tool remains a fantastic choice.
9. Crazy Egg

There are many reasons Crazy Egg is considered a superior to Google Analytics, and we’re surprised they don’t appear on more of the other lists like this one. For one thing, Google Analytics only offers users an overlay report for viewing their data as it relates to clicks. Crazy Egg, on the other hand, gives you the option of using not only an overlay report but alternatively a heat map or confetti map if you prefer. The heat map shows you exactly where visitors are clicking on your pages, so you have a visual reference of how they interact with your site. The confetti map, in contrast, allows you to segment the data by keyword, geolocation, time of day, the referral source, and many other options.
Second on our list of reasons you should seriously consider Crazy Egg as an alternative is the scroll map report feature. This allows you to immediately see whether your visitors are reading entire articles and posts before moving on to the next one, or if they lose interest halfway through.
The third reason offers a direct solution to one of Google Analytics’ errors that you can’t do anything about: the way your links are tracked. With Google Analytics, all links to the same URL are treated as one. Crazy Egg, on the other hand, differentiates between these sources. It's an attractive and affordable web analytics tool, and with a price range of $9 to $99 a month, Crazy Egg is certainly one of our top recommendations.
10. eTracker
![]()
Like every web analytics tool featured on our list of amazing web analytics tools that rival Google Analytics, eTracker provides real-time data. What’s even better, that data comprises of both qualitative and quantitative analyses, providing a superior overview. This, in turn, allows for a better evaluation of your website’s traffic.
eTracker boasts some of the same features as Crazy Egg, such as mouse movement tracking. In this way, and many others, the tool helps you collect visitor feedback that can be used to improve your usability score. The usability score is often either overlooked or overemphasized. While you certainly don’t want users to have difficulty navigating your site if you focus on your usability at the expense of other ranking factors your SEO could be negatively affected. eTracker helps you find the balance. If you’re worried about click fraud (which has to do with pay-per-click—PPC—online advertising), then put your concerns to bed. eTracker not only records suspicious activities such as click fraud but reports them as well.
Google Adwords is a popular online marketing tool used by many site owners because it’s often worth the cost. eTracker automatically integrates itself with Google Adwords to give you feedback on your campaign progress and its effectiveness.
With eTracker’s heat map, you can also identify weak spots on your site and get a better understanding of which sections are the most popular. This is an excellent way to see what works and what doesn’t so that you can improve weaker elements and better plan future content. Depending on how many of the features you want to use, you can get eTracker for anything between free and $851 a month.
11. FireStats
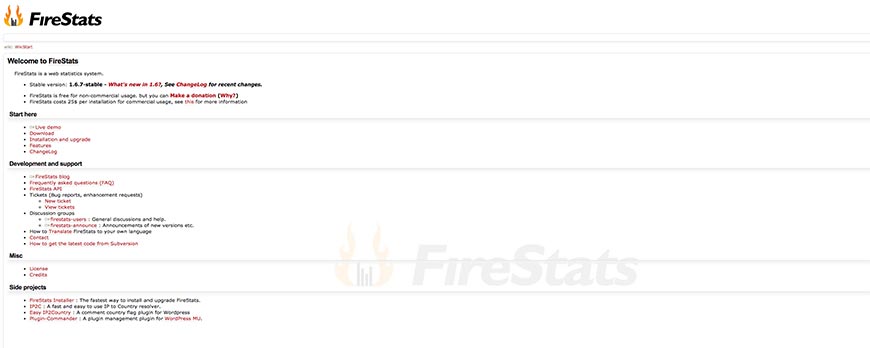
For a simple, easy to use web statistics tool that offers convenience in how you track site visitor activities, then you may want to earmark FireStats. When we say straightforward and easy to use, we mean once the installation process is complete. The actual installation is quite tricky, unfortunately, and requires some knowledge of script installation protocols as well as access to your server. And unless you have a dedicated server, or at the very least an unmanaged virtual private server (VPS), your web hosting company isn’t going to allow you to do so.
But if you have coding and script installation experience, and have either a dedicated server or VPS, then FireStats is one of the best alternatives to Google Analytics. In fact, if you have multiple sites hosted on your server, you only need one FireStats installation to monitor them all. The tool supports a vast array of languages, and you’ll also be able to download raw data logs.
Of course, FireStats works with real time data; otherwise, it wouldn’t be on our list at all. Furthermore, you’ll also get reports on the search engine queries and referral links that led visitors to your site. At the same time, you can also see which of your pages are the most popular. Together with the other data offered by FireStats, you’ll be able to discover why these pages work and others don’t.
If you’re worried about bots and spammers, FireStats filters them out based on IP, user agent, and URL. FireStats is free for non-commercial use, and a commercial license only costs $25.
12. FoxMetrics

FoxMetrics is a web analytics tool that allows you to customize the metrics according to your business requirements.
There are four main features that FoxMetrics boasts: funnels, profiles, segments, and triggers.
-
The funnels allow you to identify where your visitors are dropping an action, for example, an online purchase. This gives you the power to improve the interface so you can maximize your profits as well as return customers.
-
FoxMetrics automatically builds user profiles and creates a customer life cycle that tracks each visitor, so you know how often someone views your site content over time. This feature allows you to plan marketing and promotions to target regular users by offering a reward for their loyalty.
-
The segmentation feature is found in many of the other web analytics tools we’ve mentioned (and will still be listing). This segregates your website traffic into relevant categories, adding to the information gathered about how users are interacting with your site as well as how they access it.
-
Finally, triggers are actions that you can use to base the setup of reactions. For example, if a visitor clicks on a particular section of your site, you can assign an appropriate action, such as a pop-up.
FoxMetrics allows you to access your analytics via your phone. You’ll also be able to track software installations and newsletter views, which most web analytics tools fail to do. And if you have any third-party applications you want to use alongside FoxMetrics, the tool allows for easy integration.
Some of the features are only available on the premium packages, priced at $499 a month.
13. Gauges
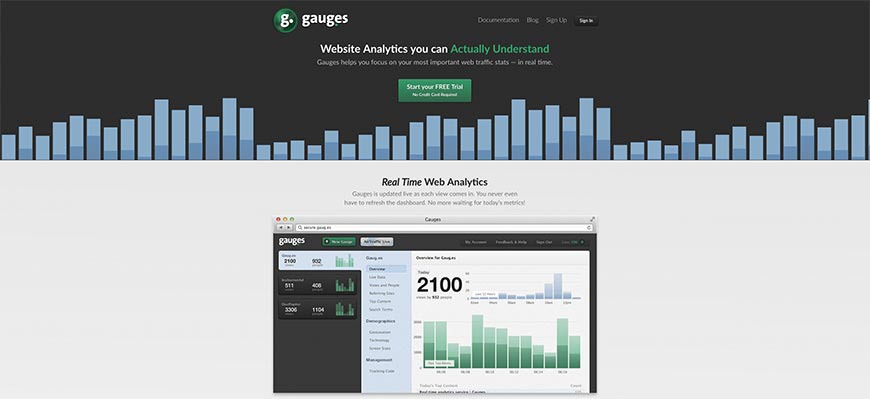
Although JavaScript is starting to be considered somewhat outdated, most of the internet still uses the coding language—including Google itself. This is why the Gauges web analytics tool has been developed using JavaScript. The user interface is easy to navigate, with an intuitive layout and categorization. The dashboard allows you to view all of the analytics data in one go, with a clear statistics overview that isn’t over-complicated.
To this same effect, Gauges also focuses mainly on the very basics of web analytics. The tool competently tracks how much traffic your site is generating, as well as where these views are coming from. This feature allows you to keep track of the way your placement on SERPs is affecting traffic, as well as telling you which referrals (backlinks from other sites) are more successful than other. Furthermore, Gauges will also show you where visitors to your site are navigating afterwards—whether they’re moving on to other pages on your site, following an external link you’ve included in your content, or if they’re heading back to the search engine to try again.
All of this information is important and can help you adjust your marketing and content strategies as well as better plan for future posts. The actionable data is made readily available in real time.
Gauges offer a free trial period, after which you can opt for one of the three great packages ranging from $6 to $48 per month.
14. GoingUp

If you’re looking for a web analytics tool that includes some basic SEO tools for your site, then look no further than GoingUp. While it doesn’t have all the features you might need for a truly extensive analysis, and the inbound marketing features aren’t as robust as other tools, GoingUp remains a very viable option for anyone looking to supplement another web analytics tool. It allows its users to track your visitors and sales, as well as your conversion rates. At the same time, the tool will also offer search strategies for you to implement. You can set up Actions and Goals for GoingUp to monitor.
All your traffic trends will be thoroughly analyzed, and the output report includes a heatmap so you can better understand how users are interacting with elements on your pages. Analysis of incoming traffic from SERPs includes the keywords used to generate that SERP, giving you a better understanding of which keywords work best.
To further aid in the above, GoingUp’s SEO tools include keyword position tracking and density. To improve your heat map results, there’s also a page optimization tool. It also helps you to keep track of and improve your Google PageRank and Alexa Rank. Integration with so many SEO features is what puts GoingUp ahead of the game when compared to other web analytics tools.
The best news of all? It’s free to use. Just sign up via email, confirm your email address, and set up your GoingUp account. There’s no limitation on how many websites you can add, which means you can also track your competitors at no extra cost.
15. GoSquared

Starting at $29 a month and ranging up to $249 depending on the number of data points, GoSquared promises to answer all your web analytics needs. By use of their Pinging tool, GoSquared tells you how long a visitor has been active on your site. When the visitor first accesses your content, a signal is sent to GoSquared and is repeated at intervals until they leave. This allows the tool to measure their time spent on your site more efficiently than what Google Analytics does.
The user-friendly interface is also highly customizable so that you can set GoSquared up the way you need it. Data is based on individual visitors, and as a collective, so you don’t have to worry that it’s using sample data the way Google Analytics does. The real-time analytics reporting also includes notifications and alerts for traffic spikes and social media trends, among others. One of the biggest ways GoSquared makes itself stand out from the other web analytics tool we’ve mentioned is a feature missing from all of them—live chat.
This integrated feature creates a widget on your site that visitors can use to open a live chat portal. You can use it to offer live support for your ecommerce shop, your online features, or to help new visitors navigate your site. It goes a long way to building long-lasting relationships with your clients, as it improves usability and the likelihood of a return visit.
We recommend using GoSquared alongside Google Analytics for one reason: once your data points are used up, you won’t be able to access your data until the following month. Google Analytics can help you gauge how many data points you’ll need so that you can adjust your account accordingly.
16. Grape Web Statistics

If you’ve got some programming experience, Grape Web Statistics is an open source analytics tool that was designed primarily for web developers. The simple interface takes into consideration how overwhelming Google Analytics can be and offers the basic statistics with a high level of accuracy. This does mean Grape Web Statistics misses some of the more advanced features found in the other tools we’ve mentioned.
But that doesn’t mean you can’t use them. If you have experience with developing in PHP or are at least adept with HTML, you can customize Grape Web Statistics to make the software meet all your needs. And therein lies the tool’s charm. If you’re happy with the basics, you won’t get distracted by the more advanced options. On the other hand, if you want some of the advanced features but not certain others, you can add those you need. Because Grape Web Statistics is open source rather than merely another free-to-use tool, you can use it as a foundation on which to build the web analytics tool you want and need. The essential features that are already present include tracking unique and total visits.
Theoretically, Grape Web Statistics works on any operating system (OS) but has only been officially tested on Windows and Linux. It does require that JavaScript is enabled on your OS and that you use PHP 4.3 or higher (anything below 5.6 is obsolete in any case) and MySQL 4 or greater. The main reason cited for JavaScript being a requirement is to prevent bots from wreaking havoc with Grape Web Statistics’ analysis.
17. Heap Analytics

Heap Analytics is a tool with a focus on user friendliness. You’ll be able to set it up with ease, allowing you to track important activity on your site without requiring any technical experience. Other than installing the tracking code onto your site, Heap works entirely on a point-and-click interface rather than using menus and settings tabs. If you want to create custom events, you can just click directly on the buttons and forms on your site and tell Heap what it is you want the tool to track for those elements.
Heap also automatically tracks monitors activity on your website (or websites if you have more than one!), analyzing it and generating a list of the most frequent events. This flexibility allows you to label and classify the activity as you wish. Heap will even do so retroactively—so if you decide to start tracking a new event, the tool will also give you statistics for that type of activity dating back to the moment the tracking code was installed.
The web analytics tool is remarkably easy to setup and use, no matter your level of expertise. It’s the exact opposite of Google Analytics regarding usability, cutting out the overwhelming stream of endless statistics and multiple screens. Heap has been designed in such a way as to actively encourage you to set up tracking and reports that will be genuinely useful based on your requirements. The Basic package is free to use and is an excellent way to start off if your site is still small and you want to test to the tool. For larger sites (or when your small site grows), you can upgrade to the Premium package. Pricing is customized according to your specific needs. The Premium package also comes with a 14-day free trial.
18. Histats

Another fantastic web analytics tool that rivals Google Analytics is Histats. The tool can give you statistics on what pages are being visited, as well as the referral process that led them there—whether they found your site on a SERP or followed a backlink. All statistics are offered in real time, of course.
Histats uses an Invisible/Visible GIF/Flash based counter to gather metrics for up to 10 million hits a day. You won’t be limited to using the tool on only one website either—you have the freedom to manage as many as three hundred, allowing you to keep track of how your competitors are performing too. Histats also provides logs, which webmasters and site owners can use in comparing campaign statistics.
Unlike most other free (and even some of the premium) web analytics tools on the market, Histats allows you to retain your amalgamated data for an unlimited period. Most tools have a limit set, usually for a year or two at best. With Histats, your analytics information can still be accessed 10+ years later.
Because Histats provides real time statistics, the tool promises to be fast and is built on a reliable network. The developers guarantee 99.99% uptimes, and more than 1,500,000,000 hits are tracked on a monthly basis for free. The analytics offered include a breakdown of recent visitors, your most active visitors, popular pages, referrers, and geolocations.
Histats also includes the browser your visitors are using to view your site, as well as what toolbars and hardware are being used. If your site is multilingual, Histats will even segregate the statistics according to the language of your visitors.
19. HubSpot

For an online marketing analysis service with a focus on your social media and other marketing platforms, Hubspot is one of the best. The web analytics tool relates your marketing to leads, Return on Investment (ROI), and search queries. This means that when you analyze your site using Hubspot, you’re getting a full breakdown of the site’s performance on every level.
Hubspot allows you to use a drag and drop method for polishing your website pages and email templates, and all the templates provided are immediately responsive. With a well-planned nod toward SEO tool integration, the analytics platform also allows you to monitor and adjust your optimization and sharing in real time, helping you get your content exposed to the right people at the right time. You’ll also be able to push your key landing pages by integrating the design of calls-to-action that bring your site visitors’ attention to these sections.
The design integration capabilities of Hubspot also allow you to polish your landing pages to maximize your traffic to sales conversion. You can also set up “drip” campaigns that help you turn leads into customers with smart email marketing. Hubspot doesn’t offer these at the expense of traditional analytics though. You’ll still receive data on how every visitor to your site interacts with your content, regardless of whether they’re browsing your e-commerce platform or reading through the blog section. All this information is, of course, applicable for integration into your marketing schemes.
You can start off with their free package, but as your business grows you’ll certainly want to upgrade to the premium package starting at $200 per month.
20. IBM Unica NetInsight
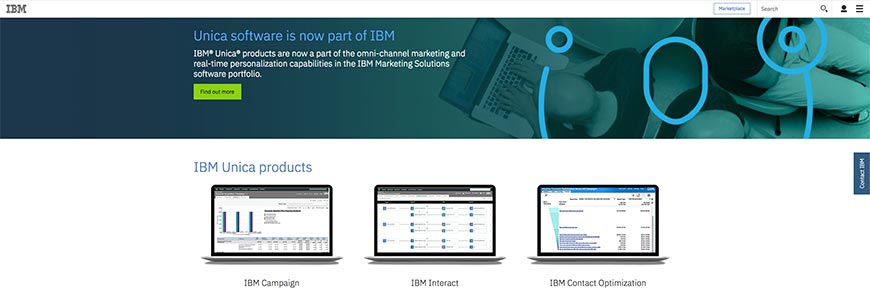
Early we mentioned CoreMetrics and how the tool became known as IBM Digital Analytics after IBM bought the company. Now, we want to introduce you to IBM Unica NetInsight. Unica NetInsight is IBM’s primary web analytics tool and is geared toward enabling users to collect every piece of data necessary for a full understanding of their website traffic. The goal is to present this information in as simple a manner as possible. Unica NetInsight is still considered a very advanced tool, however, and allows you to perform analysis on internal products behind your firewalls as well.
The reporting interface has been very well developed. Unica NetInsight is incredibly flexible on this front, offering customizable options for reporting formats. User path analysis is included, showing you the route your visitors have taken to arrive at your site and how they navigate through it.
The bigger your company, the more likely it is that you’ll have more than one staff member working on analytics. IBM understands this and allows you to not only add multiple users but to customize each dashboard according to their role or requirements.
Similar to FoxMetrics, Unica NetInsight also works with funnels to analyze and improve your conversions, as well as heat maps to give you a better understanding of how visitors are interacting with the elements of your pages. And if you use other customer relationship management (CRM) and Business Intelligence tools, you’ll be able to integrate them with Unica NetInsight because of the software’s open data architecture.
21. Inspectlet
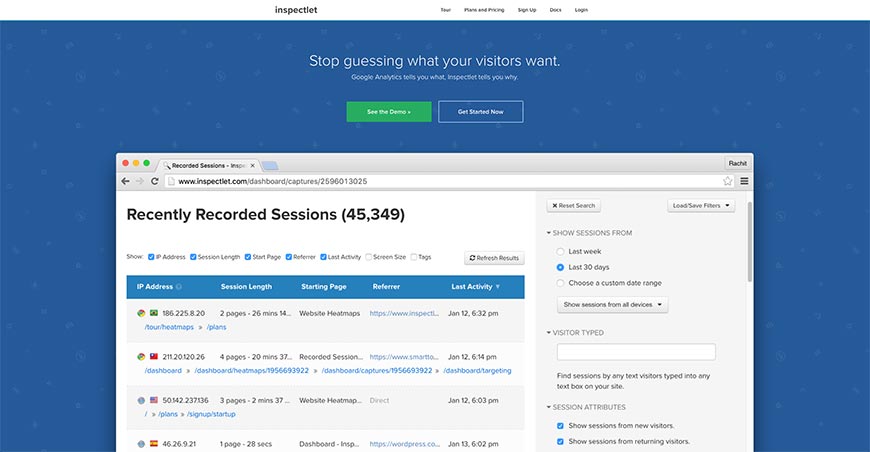
Inspectlet is not aimed at beginners. Let’s start off with that because although the web analytics tool is aimed specifically at usability, it can be quite difficult to use itself if you haven’t worked with analytics before. The reason it still makes the list of amazing web analytics tools that rival Google Analytics is because that’s exactly what it is. Despite being somewhat complicated, once you have the hang of it Inspectlet will give you a lot more than Google Analytics does.
As mentioned, Inspectlet has its focus on usability testing. The four main features are the heat maps, screen capture, personalized metrics, and—of course—real time analytics. It offers two types of heat maps: eye tracking and click. The former shows you where visitors are reading your content on the site by following their mouse movements. The latter, on the other hand, tells you how those visitors are interacting with the elements on your page by showing you where they click. A third heat map is also available, which monitors and reports on how far down your pages visitors are scrolling. Combined, these three functions tell you exactly what is happening on your site at all times. You’ll be able to identify your high points as well as your weak points.
Screen capture allows you to “record” a user’s session from start to finish so that you can see the data from the heat maps in action—again, in real time or retrospect. And of course, you can customize how all this data (and more) are displayed on your dashboard. In this way, Inspectlet promises to be exactly what you need, when and where you need it.
22. KISSmetrics
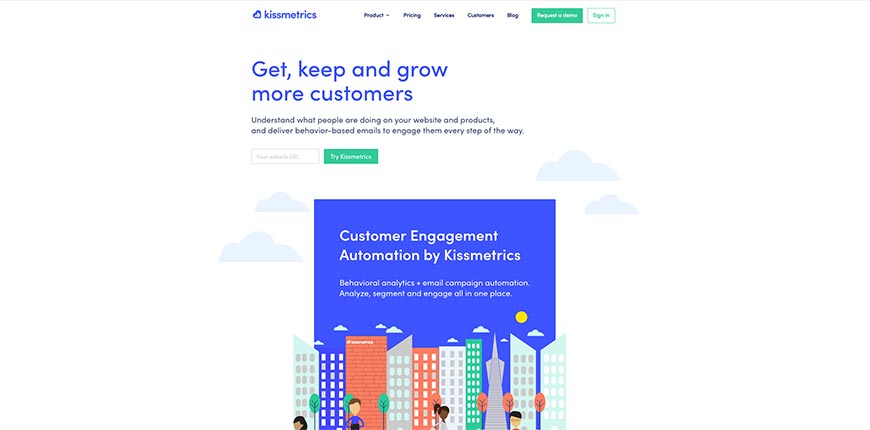
KISSmetrics make a bold claim when they promise to help you not only retain your existing customers and traffic but also boost these stats as well. Considering the web analytics tool is listed near the top on almost every single list of alternatives to Google Analytics, you can bet that they live up to their promise though.
The secret behind KISSmetrics’ substantiation of their claim lies in the type of data the tool offers. While most competitors track customer behavior on your site, and some will tell you how they got there, KISSmetrics goes the extra mile by showing you how users leave your site and how they behave immediately after. In this way, the developers have strived to take the role of the web analytics tool beyond the basic visitor statistics. They've succeeded in taking it one step ahead of many other advanced analysis report systems too.
KISSmetrics also offers a full-time report, which is automatically updated in real time to keep you aware of growing trends as they happen. The funnel feature zones in on weak points on your site that may be leading you to lose conversions, and you can opt to split the different test layouts and funnels to maximize the output. All this helps you to make informed decisions in changing and optimizing your landing pages to maximize your profits.
Setting KISSmetrics up is also rather simple, as the application programming interface (API) integration can be easily joined with your website or even your customer apps. The impressive revenue tracking function gives you an exact breakdown of your earnings and contributes to reporting how your clients are behaving online immediately after making a purchase on your site.
23. Mint
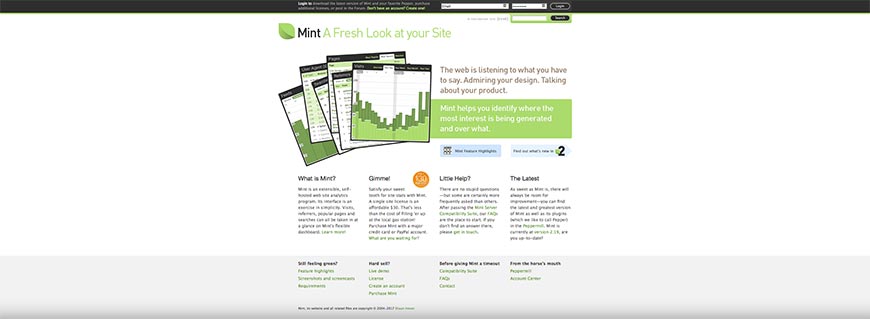
If you’re capable and willing to host your web analytics tool yourself, then you should consider making use of Mint. Every page view is included in the metrics, with a separate listing differentiating between unique visitors. You’ll also receive information on the referrals that led visitors to your site, and Mint even categorizes this data for you too. The categories used are most recent referrals used, newest referral (one that hasn’t been used before), and repeat referrals. This information shows you exactly how people are finding your site most often, and when new backlinks from external sources are being created.
Mint also includes a pages section, where the most popular and recently view content are listed. You’ll also find a bird feed feature, which tracks subscriptions, trends, and the click through rates for each item. User agent 007, another innovative Mint feature, adds the user’s browser type and their flash version to your metrics.
The interface is very well laid out, and if you have some basic experience using website tools, you can customize it quite heavily. Therein does lie the only two issues with Mint. Because you’ll need to configure it on your server, it requires some tech experience. And because it has to be hosted on your server, you’re personally responsible for the accuracy of the statistics collected: if your server isn’t properly maintained, Mint won’t perform optimally either.
On the upside, there’s a one-off cost of $30 per website you add, so there aren’t any running costs involved. Do note that Mint is currently offline for an undisclosed period, but is expected to make a triumphant return.
24. Mixpanel
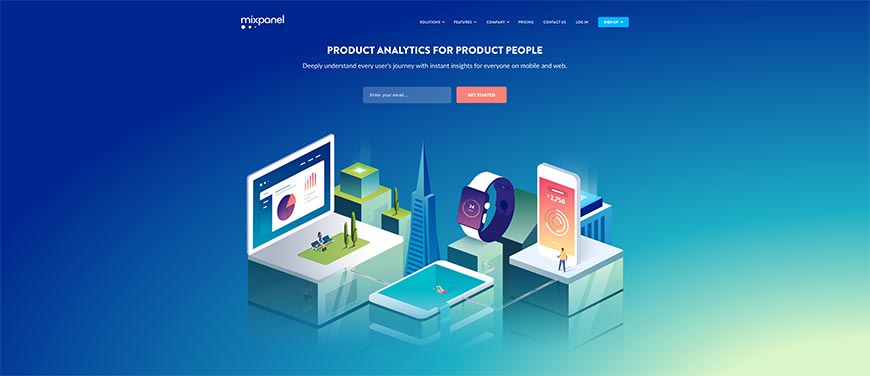
Similar to Inspectlet, Mixpanel offers a web analytics tool with real time updates and a focus on user engagement. The segmentation function is also a familiar feature, providing an easily indexed and navigated analysis report for your website’s data. Where Mixpanel does stand out somewhat in this regard is its particular focus on the mobile metrics.
This inclusion was incredibly well-planned, as mobile web surfing has become increasingly popular and is even rewriting the way SEO is performed. Almost everyone with an internet connection also has a smartphone or tablet, and these devices offer a far more convenient means of browsing, especially when you’re on the go. Mobile devices interact with browsers differently to laptops and desktop computers, and voice search especially is revolutionizing the way search engines interact with users and websites alike. In fact, Google has even been training its AI specifically for voice search queries, and this more than any other factor of mobile browsing has had a significant impact on SEO.
Mixpanel, therefore, offers you the opportunity to understand exactly how well your site is performing on this front. Because of the detailed metrics, the web analytics tool allows you to see where your weak points are, as well as your strong ones. This allows you to integrate proven methods that work on your site to strengthen more vulnerable pages and better plan future ones. Mobile browsing and voice search aren’t just the future anymore; they’re fast becoming the present. Mixpanel is one of the few web analytics tools currently available that are already designed to help put you ahead of the game.
25. Open Web Analytics

Another open source alternative to Google Analytics, Open Web Analytics is also marketed toward tech experts who have experience with installing PHP based programs directly onto a server. Admittedly, customizing the source code also requires some extensive developing experience. But the fact remains that Open Web Analytics is still a step up from Google Analytics. Although the initial setup and configuration (including customization) are rather complicated, all the key features of Google Analytics plus more are there. Being open source, the tool is very flexible and can be added to in any way you wish, so you can add as many features as you want.
Considering you won’t have to pay for Open Web Analytics, it’s got a surprising number of features already included. The underlying code offers statistics filters, and heat maps from the get go. If you don’t have developing experience or know how to install PHP applications, you can quickly hire someone who does to do the setup for you. You won’t need to have them constantly on standby because once the tool is setup, it’s easy to use. If you’re still wary, then simply get the WordPress plugin version.
Another major way in which Open Web Analytics is superior to Google Analytics is the control and ownership it affords you. With Open Web Analytics, you have full control over your website’s analysis data. Unlike Google Analytics, the tool doesn’t share that data with any third parties—a major privacy concern for Google Analytics users.
26. Piwik
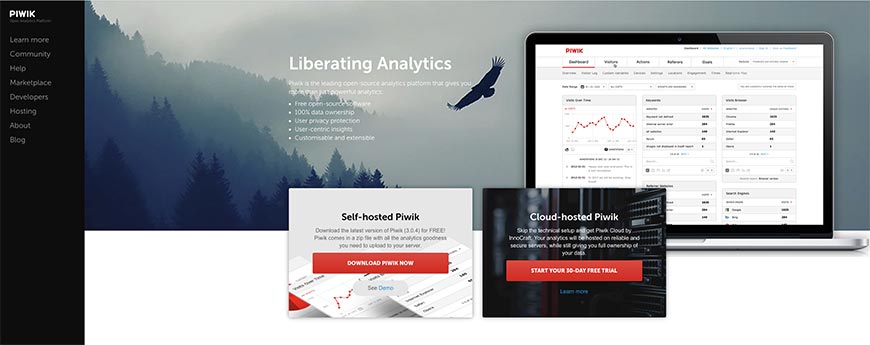
If you’re still not convinced by any of the other web analytics tools we’ve already mentioned, then Piwik could be what you’re looking for. Like many of the tools on our list, Piwik runs on PHP and MySQL—and similar to some, it’s an open source program, so you won’t have to pay to use it. Where it rises above other open source web analytics tools like Open Web Analysis is that it’s very easy to install and set up.
Piwik works via a plugin mechanism, which also makes it highly customizable. If you want to add features, you only install the appropriate plugin. This also applies to the dashboard itself—although you won’t necessarily need any plugins to do so, you can customize the interface extensively. All of the data it gathers and presents is stored directly on your server, so you’ll have full control of every aspect and won’t have that information shared with any third parties. This data includes a list of the keywords ranking highest.
If you want to keep your disk space clear, you can allow Piwik to delete old data automatically. You may want to access that data at a later stage though, which is why the tool also allows you to export your reports in a variety of file formats, including PHP, XML, and Excel.
One of the innovative features almost entirely unique to Piwik is the ability to block traffic, URLs, and IP addresses without having to navigate to your firewall first. If you pick up on any click fraud (which we mentioned earlier in the section on eTracker), you can immediately block that user from re-accessing your site.
27. SiteCatalyst

If your site and your business are significant enough to warrant an enterprise web analytics tool, and you can afford to pay premium fees, then SiteCatalyst is a solution you certainly won’t want to ignore. Granted, it’ll cost you a few thousand dollars a month, but we think you’ll find it worth the expense.
The dashboard is highly customizable, so you can set the tool up the way you want and need it. As you would expect from an enterprise web analytics tool, you can also view all your analysis reports on all your devices. Whether you’re sitting with your laptop, desktop, tablet or smartphone, you shouldn’t be limited in your access to your information, and SiteCatalyst understands that.
You can also set up metrics for recording actionable key performance (APK) indicators, such as visitor profiles and customer loyalty. Linked to this is the purchasing info reports, which combined give you an in-depth understanding of how individual clients behave on your site and interact with your business. This gives you the power to offer special promotions and use targeted marketing strategies to your advantage, and to reward loyal customers.
SiteCatalyst also allows you to create visitor paths to track user navigation and makes use of funnels to help you zone in on weak points in your layout, design, and content. Combined with the rich media analytics missing from most other web analytics tools, SiteCatalyst promises and succeeds in delivering top-quality visitor intelligence in real-time.
28. StatCounter
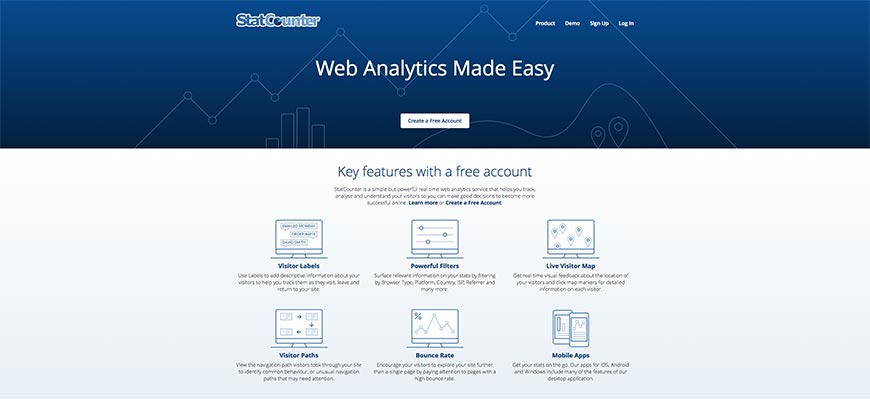
If Google Analytics is telling you that you have 9,000 page views or less a day, then you should consider StatCounter as a free alternative. Which isn’t to say that you can’t use the tool if you’re getting more than 9,000 page views per day, of course—it just means you’d have to upgrade to the premium Growth plan at $29.99. It’s a powerful and reliable web analytics tool, and can also be customized to match your data requirements. Unlike some analytics programs, it doesn’t offer server side statistics as a focus—instead, by incorporating a unique code on your website, StatCounter puts its primary focus on gathering information about your visitors.
You’ll enjoy real time reports of course, like all the other tools we list, and the analysis reports are presented on two levels. First, Simple Aggregate statistics about your visitors. Second, a highly detailed report that includes geolocation, the number of pages they browse on your site, which page was their entry point and which their exit point, as well as what referrer led them to your site in the first place.
If the visitor accessed your site from a SERP, StatCounter would give you information about the search query and keywords used as well, much like the other web analytics tools mentioned in our list. And if you’re in the habit of visiting your site from time to time, you can also place a blocking cookie on your browser, which will let StatCounter know not to include your visits in its analysis.
29. Stuffed Tracker
![]()
Stuffed Tracker is one of the oldest downloadable website traffic analytics programs on the market, having launched in-2002 (similar to Reinvigorate). There haven’t been as many updates to the tool in recent years as before, but it’s still a powerful rival to Google Analytics. With a unique set of tools, Stuffed Tracker gathers your website statistics and analyzes your users’ activity. In fact, Stuffed Tracker is considered the inspiration for other web analytics tools’ inclusion of features that monitor the entry and exit pages visitors use on your site, as well as heat maps and other similar functions.
You’ll also be able to compare statistics for organic traffic with data on the paid traffic you generate. This includes banner advertisements that lead viewers to your site, pay per click schemas, and both email and affiliate marketing strategies. Once again, Stuffed Tracker is considered the inspiration for the inclusion of such features in other tools that have been developed since.
Another way in which the web analytics program set new benchmarks in the industry is the way it tells you exactly which of those ads and incoming (as well as internal) backlinks have been converted to online sales.
Stuffed Tracker isn’t free or open source, but it is incredibly affordable compared to many of its competitors, costing only $70 for six months. Installation can be challenging for beginners, as it’s not a hosted solution, but using the tool is relatively straightforward.
30. Webalizer

If you’re looking for a fundamental server side web analytics tool and don’t mind having to host it yourself, you should take a look at Webalizer. Despite being basic, it does offer detailed reports in HTML form, and the primary interface comprises of a summary graph and monthly statistics table. Included are links to deeper analysis on different categories of data.
The first covers the visitor information you’re looking for, such as the type of browser they’re using, how they found your page, which pages they’ve looked at, and what keywords they used in a search engine query to find your site. You’ll also receive updates on the time they visited, which can also be viewed according to the hour, day, month, and year. All Webalizer data is presented in such a way as to make integrating the report onto a spreadsheet as easy as possible.
Your log files will be updated on a constant basis, and you can view them online as well as download them for use with other programs as necessary (or to print them for business meetings). The reports aren’t complicated, and even pure novices will have no difficulty in translating the data into actionable plans. While it’s mostly self-explanatory, Webalizer ensures that all its users know exactly what they’re looking at by providing basic tutorials with screenshots and labels.
Available free of charge, Webalizer is comparable to AWStats, and as such is best used in conjunction with another web analytics tool rather than as a standalone. If you’re looking for something to run alongside Google Analytics rather than replace it entirely (or to run alongside AWStats instead of Google Analytics, for that matter), then it’s a worthy competitor.
31. Webtrends Analytics
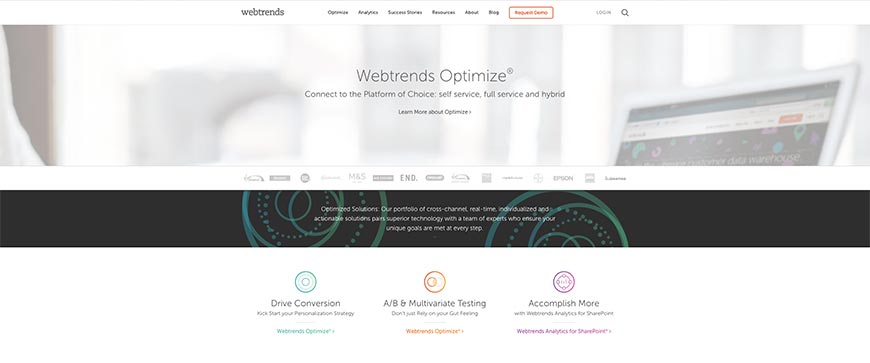
Webtrends Analytics is the oldest website analytics and tracking tools. The program originated in 1993 when most site owners were focused more on adding as much content as possible rather than monitoring what their users were interested in. It’s certainly encouraging to find that the first tool ever to be made available for analyzing your website traffic is still operational.
That said, if your budget is limited, then Webtrends Analytics is not for you. It’s an incredibly premium enterprise tool, and because of its affiliation with Microsoft (who are also one of their loyal clients), the tool comes at a steep price. Depending on your requirements, Webtrends Analytics can set you back as much as $100,000!
Don’t let that put you off though—even if you can’t afford to use the tool right now, you’ll certainly want to work your way toward being able to spend $10,000 (the average starting price) on your web analytics software. It’s a real pleasure to work with as well, giving users a truly in-depth report on advanced information that most of its competitors leave out.
Web marketing, mobile marketing, and social media marketing are the three most important marketing tiers that Webtrends Analytics focuses on. Analytics on visitor behavior is also well presented and cover a vast range of metrics. Webtrends Analytics is exactly the type of tool you want to be using to track your website traffic, and will indeed appear on any authoritative listing of fantastic alternatives to Google Analytics.
32. Woopra
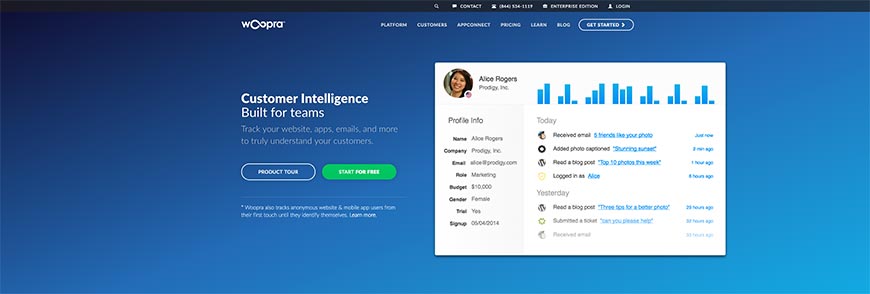
If the free 9,000 views per month available from StatCounter are not enough, but you’re still not yet ready to start paying for a worthy rival to Google Analytics, then Woopra is what you’re looking for. While there are enterprise packages available (ranging up to $199.95 a month), Woopra does offer users up to 30,000 actions free of charge.
It is, of course, a web analytics tool that provides real time reports with a focus on customer engagement. You’ll also be able to monitor multiple websites simultaneously, and the interface is designed to allow you to easily distinguish between them as well. It’s based entirely online, which means you can run Woopra in the background via a pinned tab on your browser and drop in as often as you like. At any time, you can choose to see exactly what every visitor to your site is doing by clicking on the number of users displayed.
Blog posts and comments can be included in the analysis reports, and searches can also be added to the mix. Woopra’s dashboard is incredibly well-thought out, with maximum usability in mind. This rings true for their WordPress plugin too.
Another exciting feature that we’ve only seen available with GoSquared is the live chat feature, which allows you to interact with your users while they interact with your site. And this is the focus of Woopra as a web analytics tool—to show you how your website is being used, rather than just who is using it.
33. W3Counter

Similar to StatCounter, but with a dashboard that is better designed and more user-friendly, W3Counter rounds up our list of the top 35 amazing web analytics tools that rival Google Analytics. It only takes a few clicks to see every kind of statistic you could ever wish to monitor, including visitor data, heat maps, maps showing you the geolocations of your users, entry and exit pages, and so much more. W3Counter also includes a click overlay feature, which shows you exactly where users are clicking on your website and what it means for you.
If you’ve got little traffic at the moment and don’t mind having a visible W3Counter badge displayed on your site, then the tool is yours to use free of charge. Unfortunately, this does also mean that your use of the analytics program is supported by advertising, which may not be appropriate depending on the nature of your business.
But there are premium packages available that do away with the ads, badge, and some of the restrictions imposed on the free version. You’ll also benefit from a few additional features, which include email summaries (starting with the Pro plan at the ridiculously low price of only $5 per month). The largest package available, Business ($20 per month) also offers a built-in link shortener, which makes your links easier to read—and therefore more attractive to users—and full conversion tracking.
Related Articles
- 4 Easy Ways to Search a Website for a Specific Word
- Should You Use Nofollow Links For SEO
- White Hat SEO vs. Black Hat SEO
- Redirection and the Impact on SEO Rankings
- 12 Page Speed Best Practices to Follow for SEO
- All About the Robots.txt File
- What is Speakable and How Can it Help Voice Search SEO?
- How to Prevent Blacklisting When Scraping
- JavaScript (JS) and Search Engine Optimization (SEO)
- What is Negative SEO, and How to Defend Yourself
- The History of SEO and Search Engines
- How to Build a Website for Search Engine Optimization
- Duplicate Content Issues Hurting Your SEO
- Top 10 Backlink Checker Tools for SEO
- Why Does SEO Take So Long for Search Engine Success?
- Top 10 Content Planning Tools for Content Marketing
- Seo Copywriting: How to Write for Search Engine Optimization
- Top 15 Tools for Measuring Website or Application Speed
- Top 25 SEO Tips for eCommerce Websites
- Top 15 Plagiarism Tools for Finding Duplicate Content
- Top 25 SEO Blogs to Stay Up-to-date with Search
- The Best Content Management System (CMS) for SEO
- Social Media & SEO: Why Your SEO Strategy Needs To Include Social
- HTTP or HTTPS? The SEO Impact of Using SSL Certificates
- 25 Ways to Build Backlinks to Your Website for Free
- What Is Structured Data and Why You Need It for SEO
- 60 Innovative Website Crawlers for Content Monitoring
- Voice Search: How Our Voices Mold the Future of SEO
- Crawl Budgets. How to Stay in Google's Good Graces
- 30 Awesome Keyword Ranking Tools for SEO
- 43 Amazing Websites to Learn SEO Online
- Pagination or Infinite Scroll for SEO?
- How to Get Started Using Google Search Console for SEO
- CMS Plugins for Google AMP (Accelerated Mobile Pages)
- Are Keywords Still Important for SEO?
- Do Sitemaps Help SEO? The Importance of Sitemaps for SEO
- Getting Started with Search Engine Optimization
- SEO vs. PPC: Which One Should You Choose?
- How to Make Your Content Search-Friendly
- Best URL Structure for SEO
Create Visual Sitemaps
Create, edit, customize, and share visual sitemaps integrated with Google Analytics for easy discovery, planning, and collaboration.
Popular Tags
Search Engine Optimization SEO Accessibility Testing Create Sitemaps Sitemaps UX User Experience Sitemap Generator Content Audit Visual Sitemap GeneratorGet Started with DYNO Mapper
Join thousands of professionals using the most advanced visual sitemap tool to simplify discovery, IA, and content planning.
👉 Start Your Free Trial — No credit card required.


