Google Analytics
10 of the Most Important Google Analytics Metrics to Track Posted 07.06.2016

When you are a brand that has a website with useful content or unique products, your website is destined to attract an audience. Even so, you must be able to hold and convert the potential customers into loyal customers. This all depends on how you choose to optimize and use these metrics so that they best fit your brand and website. There are so many different ways that a website can increase their rates of retention and conversion, but prior to taking on the endeavor you must figure out which specific metrics it is that you are trying to improve for your brand. Use this as a guide to help you determine which metrics are the most important to track. You will find most of these metrics in the Audience section within the dashboard of Google Analytics, along with other metrics that aid you in tracking your website traffic. When you proceed armed with this knowledge, there will be nothing stopping you from growing your website in the way that is best for your brand.
Read more
DYNO Mapper is the first and only Sitemap Generator to include Google Analytics integration
DYNO Mapper includes the ability to integrate your website’s Google Analytics data. It is easy to integrate by just following a two step process of 1) connecting your Google Analytics account and 2) choosing the desired sitemap that matches your data. The process takes only a few seconds to setup. DYNO Mapper will sync and display the data for each page on your sitemap and also include global site data. You can select data from Today, Yesterday, Last 7 Days, Last 30 Days, This Month, Last Month, and Custom Ranges. DYNO Mapper also gives you the ability compare two different date ranges.
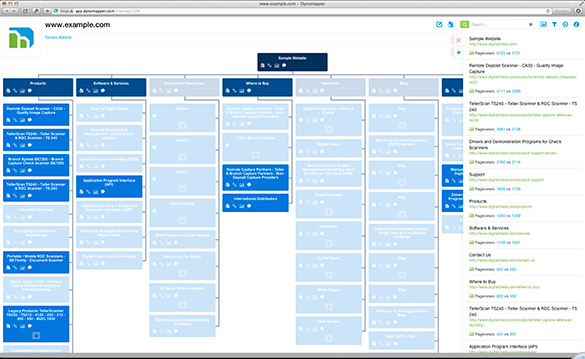
DYNO Mapper can filter the pages on your sitemap using Google Analytics metrics. Using this feature helps users quickly identify and display pages of high priority and ones that are of zero importance to the average visitor to a particular website. The Google Analytics filter capability can also be shared with each sitemap allowing end users to also take full advantage of this powerful feature.
 Filter by Analytics: Metrics
- Pageviews
- Unique Pageviews
- Avg. Time on Page
- Entrances
- Bounce Rate
- % Exit
Filter by Analytics: Operators
- top
- bottom
- greater than
- less than
- greater than or equal
- less than or equal
- equal
- between
Filter by Analytics: Value
- Choose any value
Using the Filter by Analytics allows users to combine metrics, operators, and values to see the results highlighted on the display of each sitemap. The example shows a filter of Pageviews Top 80%. This will display which pages on your sitemap that are receiving the top 80% of Pageviews within a specified date range. This lets users quickly read, analyze, and draw conclusions from the provided analytics data. After a user filters, the results are also display in list form on the right side flyout list that includes the page title, url, metric, and value. Clicking any of the result pages in the results list will take users to that page.
Read moreCreate Visual Sitemaps
Create, edit, customize, and share visual sitemaps integrated with Google Analytics for easy discovery, planning, and collaboration.
Popular Tags
Search Engine Optimization SEO Accessibility Testing Create Sitemaps Sitemaps UX User Experience Sitemap Generator Content Audit Visual Sitemap Generator
Get Started with DYNO Mapper
Join thousands of professionals using the most advanced visual sitemap tool to simplify discovery, IA, and content planning.
👉 Start Your Free Trial — No credit card required.