
Why use a SaaS analytics tool?
SaaS — short for software as a service — is a subscription-based model of software licensing and delivery, centrally hosted in the cloud and accessed through a web browser, mobile app, or API. It now dominates every corner of business software: CRM, accounting, HR, content management, design, analytics, and more. What makes SaaS distinct from traditional software isn’t just the delivery model; it’s the financials. Revenue arrives in small, recurring increments. Customers come and go. Growth depends on keeping them longer than you paid to acquire them.
That economic shape is what makes SaaS analytics a separate discipline from general product or web analytics. Tools like Google Analytics 4 or Mixpanel tell you what users do on your site. They don’t tell you your monthly recurring revenue, your net revenue retention, or how much a cohort of January 2025 sign-ups is worth today. For that, you need a tool that connects to your billing system and does the recurring-revenue math for you.
Below are six tools that do exactly that in 2026. Three of them have been category staples for a decade. Three are newer entries — or replacements for tools that shut down since the original version of this article. All six integrate with Stripe; most support Braintree, Chargebee, Recurly, Chargify/Maxio, and Paddle as well. All of them replace the fragile spreadsheet that every SaaS founder eventually gives up on.
The SaaS metrics that actually matter
Before the tools, the numbers. These are the core metrics every subscription business tracks, and any analytics platform worth using calculates them correctly out of the box:
- Monthly Recurring Revenue (MRR). The normalized monthly value of all active subscriptions. Annual plans are divided by 12. It’s the heartbeat of the business — the single number investors ask about first.
- Annual Recurring Revenue (ARR). MRR × 12. More common in enterprise-focused B2B SaaS where annual contracts are the norm.
- Churn rate. Customer churn is the percentage of customers lost in a period; revenue churn is the percentage of MRR lost. The two can move in opposite directions if you lose small customers while keeping large ones.
- Net Revenue Retention (NRR). Revenue from existing customers at the end of a period ÷ revenue from those same customers at the start, including expansion and contraction. NRR above 100% means your existing base is growing even without new sales. Best-in-class B2B SaaS targets 120%+.
- Customer Acquisition Cost (CAC). Total sales and marketing spend ÷ new customers acquired. Informs every growth decision.
- Lifetime Value (LTV). The total revenue you expect from an average customer over their lifetime. The LTV:CAC ratio is the single best indicator of unit economics — 3:1 is healthy, under 1:1 means you’re burning money.
- Failed payments and involuntary churn. Up to a third of churn in credit-card-based SaaS is involuntary — expired cards, insufficient funds, issuer declines. Dunning (smart retry logic) recovers a meaningful share.
Most of these metrics can be calculated from your billing data alone. That’s why the tools below plug directly into Stripe or Braintree — no JavaScript snippets, no event tracking, no engineering time. You connect your billing account, and the dashboard populates within minutes.
The 6 best SaaS analytics tools in 2026
1. ProfitWell Metrics by Paddle
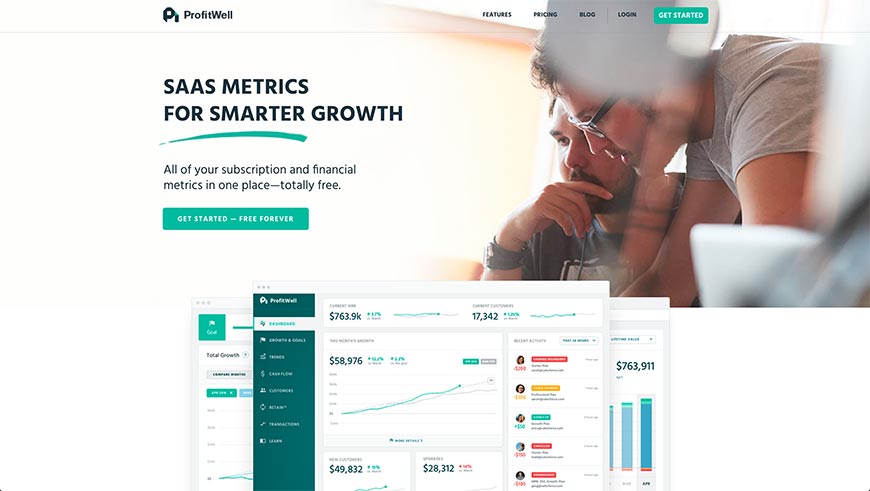
ProfitWell was acquired by Paddle in 2022 and lives on as ProfitWell Metrics, Paddle’s free subscription analytics product. It remains one of the only genuinely free options in the category — no seat limits, no MRR ceilings — and that’s still the headline reason thousands of early-stage SaaS companies start here. You connect Stripe, Braintree, Chargebee, Recurly, or Paddle Billing and get MRR, churn, LTV, ARPU, cohort reports, and industry benchmarks from Paddle’s cross-customer dataset.
What changed under Paddle is integration depth. ProfitWell Metrics now sits alongside Paddle’s Merchant-of-Record billing product, so if you eventually outgrow DIY billing on Stripe, you can move your subscriptions onto Paddle without losing your historical metrics. Daily email reports, mobile apps, and lead-scoring features remain. For companies under $1M ARR that don’t want to pay for analytics, ProfitWell is still the default first choice — and the price hasn’t changed.
2. Baremetrics
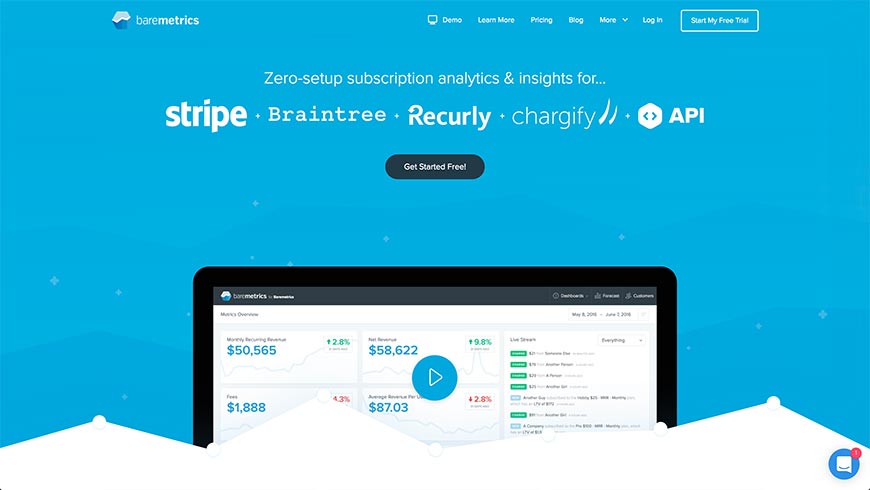
Baremetrics is the category’s long-running independent. It calculates 26+ SaaS metrics — MRR, net revenue, refunds, failed charges, ARPU, LTV, cohort retention, quick ratio — with zero configuration once your billing source is connected. Supported connections include Stripe, Braintree, Chargebee, Recurly, Chargify/Maxio, and Shopify Partners, plus a manual-entry option for hybrid businesses.
Two Baremetrics features distinguish it from the free tier. Recover is a full dunning suite that retries failed payments, sends branded reminder emails, and updates cards via Account Updater; customers routinely recover 15–40% of involuntary churn with it. Forecast+ uses your historical data to project MRR 12–36 months out, with scenario modeling for growth, churn, and pricing changes. Paid plans start around $129/month for companies under $10k MRR and scale with volume. A 14-day free trial is standard. If ProfitWell is where you start, Baremetrics is where most serious SaaS businesses land by their Series A.
3. Maxio
(Replaced the original MainMetrics, which went dormant in 2021 and no longer receives updates.)
Maxio is what happened when two of the biggest names in SaaS finance — SaaSOptics (subscription management) and Chargify (billing) — merged and rebranded in 2022. The result is an all-in-one financial operations platform purpose-built for B2B SaaS: subscription billing, revenue recognition (ASC 606 compliant), ARR/MRR analytics, cohort reporting, and 30+ pre-built investor-grade reports.
Where Baremetrics and ProfitWell are billing-system-agnostic dashboards, Maxio runs the billing itself. That’s overkill for a bootstrapped $10k-MRR startup and exactly right for a Series B company managing multi-year contracts, usage-based pricing, co-term adjustments, and mid-cycle proration. Maxio also integrates with 85+ systems including NetSuite, QuickBooks, Salesforce, and HubSpot, which matters once finance and RevOps become separate functions. Pricing is quote-based and reflects the enterprise positioning — expect conversations with sales, not self-serve sign-up.
4. ChartMogul
ChartMogul occupies the space between ProfitWell’s simplicity and Maxio’s complexity. It imports subscription data from Stripe, Braintree, Chargebee, Recurly, Paddle, and Maxio itself, then exposes it through a clean dashboard plus a genuinely powerful segmentation layer. Data Enrichment lets you attach custom attributes (plan tier, industry, ACV band, sales rep) to customers, so you can slice MRR and churn by whatever dimensions matter to your business.
ChartMogul’s cohort and retention reports are the best in the category for investor storytelling — expansion, contraction, reactivation, and new-business MRR are broken out cleanly. A free tier exists for companies under $10k MRR and up to 200 customers, which makes it a realistic competitor to ProfitWell for the smallest startups. Paid plans start around $100/month. If you expect to fundraise in the next 18 months, ChartMogul is the tool whose screenshots end up in your pitch deck.
5. Putler
(Replaced the original in-sight.io, whose site now redirects to a generic lander and appears to be abandoned.)
Putler is aimed at a different buyer than the first four tools: e-commerce and indie SaaS operators running on Stripe, PayPal, Braintree, WooCommerce, Shopify, Square, or Authorize.Net — often several at once. It consolidates data from all connected sources into a single revenue dashboard with 200+ metrics, then layers in product analytics, customer segmentation, RFM analysis, and subscription reporting.
The appeal is breadth for the price. Plans start around $30/month, which is aggressive for the feature set — you get both SaaS-style subscription metrics and traditional e-commerce metrics (AOV, top products, refund rates) in one place. Putler is a particularly good fit for agencies managing multiple client stores, or founders running a mix of one-time product sales and recurring subscriptions. It’s not as deep as Baremetrics on pure SaaS analytics, but it’s considerably cheaper and broader.
6. Equals
(Replaced the original BTMetrics, whose domain is now parked and offered for sale.)
Equals is the newest entrant on this list and takes a different approach entirely. Rather than a fixed dashboard, Equals is a spreadsheet built on top of a SQL engine — with native connectors to Stripe, HubSpot, Salesforce, Snowflake, BigQuery, Postgres, and dozens more. It ships with SaaS metrics templates (MRR waterfall, cohort retention, CAC payback, board reporting packs) that you can open, connect to your data, and have running in under an hour.
The appeal is flexibility. Baremetrics and ChartMogul give you the metrics they think you need. Equals gives you the underlying data and a familiar spreadsheet interface, so when your CFO asks “what does net retention look like excluding Q4 seasonal customers over $50k ACV,” you can answer without engineering tickets. It also handles live, auto-refreshing dashboards and scheduled email reports. Paid plans start at $99/month. For analytics-literate teams that have outgrown ProfitWell but don’t want the rigidity of a dedicated dashboard tool, Equals has become the 2026 go-to.
How to choose between them
The six tools above solve the same core problem — turning billing events into business metrics — at very different price points and levels of control. A rough decision framework:
- Under $10k MRR, Stripe-only, want something free today: ProfitWell Metrics by Paddle, or ChartMogul’s free tier if you want a cleaner UI.
- $10k–$500k MRR, serious about dunning and forecasting: Baremetrics.
- $10k–$500k MRR, fundraising soon, want investor-polish reports: ChartMogul.
- $500k+ MRR, B2B, need billing + revenue recognition + analytics in one system: Maxio.
- Multi-channel e-commerce or agency managing multiple stores: Putler.
- Analytics-heavy team, custom KPIs, live board reporting: Equals.
None of these tools replace product analytics (Mixpanel, Amplitude, PostHog, Heap) or customer success platforms (Vitally, ChurnZero, Catalyst). They answer a different question: how is the business doing financially? For most SaaS companies, the right stack includes one tool from this list plus one product analytics tool — not a single platform trying to do both.
Frequently asked questions
What’s the difference between SaaS analytics and product analytics?
SaaS analytics (ProfitWell, Baremetrics, ChartMogul, Maxio) measures financial health: MRR, churn, LTV, cohort revenue retention. The data source is your billing system. Product analytics (Mixpanel, Amplitude, PostHog) measures user behavior: which features get used, where people drop off, what activation looks like. The data source is event tracking in your app. Most growing SaaS companies need one tool of each type — they answer complementary questions.
Is ProfitWell Metrics still free in 2026?
Yes. Paddle has maintained ProfitWell Metrics as a free product since the 2022 acquisition, with no MRR ceiling or seat limit on the core metrics dashboard. Paddle monetizes adjacent products (Retain for dunning, Paddle Billing as a Merchant of Record) but the metrics dashboard itself is free for any connected billing source.
Do I need a SaaS analytics tool if my whole business is on Stripe?
Stripe’s built-in dashboard shows revenue, failed payments, and subscription counts, but it doesn’t calculate MRR the way investors and SaaS operators expect — no normalized MRR, no revenue cohorts, no net retention, no ARPU segmentation. For a pre-revenue or pre-seed company, Stripe alone is enough. Once you’re reporting metrics to a board or investors, or making pricing decisions based on churn, a dedicated tool pays for itself quickly. ProfitWell is free, so the cost barrier for the first step is zero.
Can I switch between these tools later without losing history?
Mostly yes — the tools read from your billing source, not a proprietary data store, so when you connect Baremetrics or ChartMogul to an existing Stripe account, they backfill historical metrics from day one. The exception is Maxio, which replaces your billing system rather than sitting alongside it; switching to or from Maxio is a billing migration, not a dashboard swap, and should be planned accordingly.
What about churn prediction with AI — is that a standalone category?
Increasingly, yes. Tools like ChurnKey, Vitally, and ChurnZero use product usage signals to flag at-risk accounts before they cancel, and run automated retention playbooks. These aren’t analytics tools in the billing-dashboard sense; they’re customer-success platforms. If voluntary churn is your biggest leak, add one of these alongside (not instead of) a tool from this list.
Bottom line
Tracking SaaS metrics in a spreadsheet might work for the first month. It does not scale. Every tool on this list pulls directly from your billing source, calculates the numbers the same way investors and SaaS operators calculate them, and updates in real time. ProfitWell Metrics by Paddle remains the right place to start for free; Baremetrics and ChartMogul are where most companies settle as they scale; Maxio covers the enterprise end; Putler and Equals cover the edges. Pick the one that matches your stage, connect your billing account, and reclaim the hours you’d otherwise spend building dashboards from CSV exports.